Does Your SQL Server Have Performance Issues?
Find out with the database health monitor
Database Health Monitor is a powerful performance monitoring and diagnostics solution that shows administrators server health, performance or availability problems within their SQL Server environment, all from a central console.
Helping Administrators Perform Monitoring Faster
The historic wait stats monitoring the instance level reports that give a quick overview of your SQL Server. Our tool helps you monitor and quickly understand the health of your database.
Save time tuning with the Database Health Reports

Database overview including:
- backups
- disk space
- duplicate indexes
- index fragmentation
- long running queries
- one time use queries
- plan cache
- queries needing params
- statistics
- stored procs with the most logical writes
- unused indexes.
The server overview includes:
- connections by database
- CPU usage
- page reads by database
- page writes by database
- plan cache by database
- queries needing params
- waits and more
Monitor your SQL Server environments from a central console. There is no limit to the number of servers you can monitor. Download Now
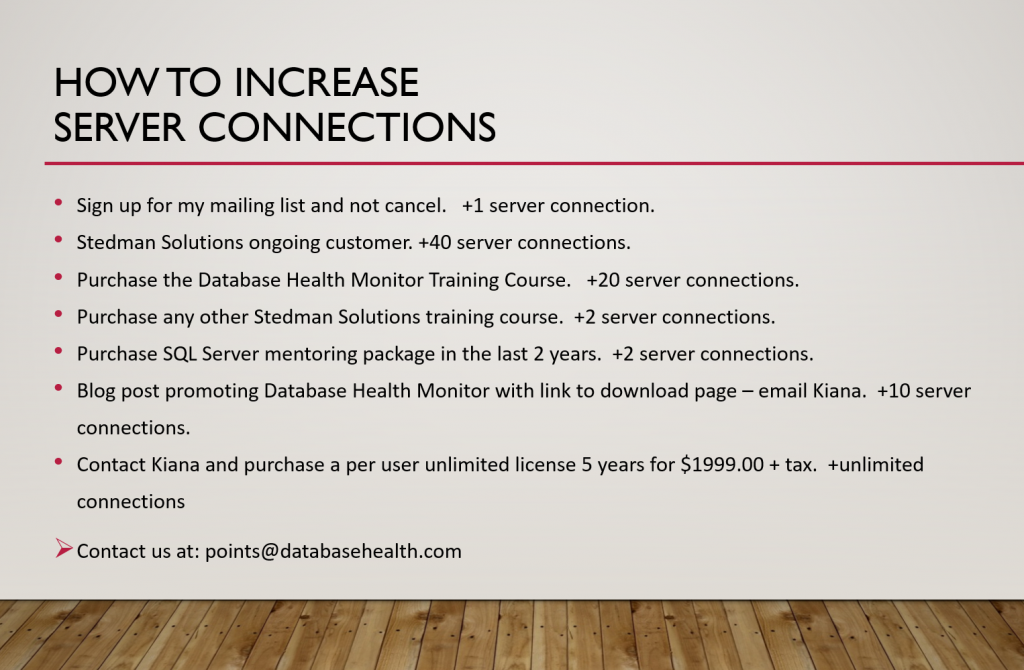
Free for a 1 server connection, paid and gamification options for connecting to more SQL Servers.
Licensing Explained
What’s in the tool?

Database Health Monitor is a tool built by Steve Stedman to help SQL Server administrators find the performance issues or bottlenecks on SQL Server. The tool started as a way to help gather metrics for our own environments in 2010 and we have added to it and ensure it continues to work in the latest versions of SQL Server. The tool is now available for free.
We know you will benefit from using this tool to monitor your environments. If this works for you and helps, great! If you would be so kind and tell others about, you have our thanks.
Download for free now…
Interested? Simply schedule a free consultation to review what you have in mind.
Enroll Today!


Steve and the team at Stedman Solutions are here for all your SQL Server needs.
Contact us today for your free 30 minute consultation..
We are ready to help!
 Download this page in PDF format
Nice work!
how can i get the full version??
The beta version is the full version as far as the features go. After a few more betas, the full version will be available, but its not available yet. Stick with the free beta for now.
Tool is very good and use-full , Thanks a lot for Sharing it with everyone.
Awesome!
I have one suggestion… It would be great if this tool was somehow expandable by adding your own queries.
Thanks for the good work.
Thanks for the great suggestion. I will see what I can do.
IT would be great if you could type in the window credentials versus passing them through.
Great tool, thanks so much!
Thanks for the feedback!
Just found this tool and am loving it. Two comments, one a request and the other a possible bug.
Request: For the Technical debt, it would be nice if one could add additional items.
Possible Bug: Your query for Big Clustered indexes returns multiples for nvarchar columns. I believe this is due to the query’s inner join between sys.all_columns and sys.types. Sys.types has two entries for system_type_id=231 (nvarchar and sysname)
Thanks for the feedback. I will look into the big clustered indexes.
I have been thinking about ways to add additional items to the technical debt. This may be available in a future version.
Thanks!
Thanks for reporting the crash. This has been fixed in beta 8.1 which has just been released. http://DatabaseHealth.com/Download
Bill,
Thanks for the feedback. I have updated the exception handling in the charts. This should be resolved in the next beta.
-Steve
Steve…is there any way to take the charts and graphs as well as the data as shown in the gui and simply (via a job) direct them to a folder (say on sharepoint)
Bill,
Currently there is not a way to do that, but it is a great suggestion. I will put it in my backlog and see when we could get it into a future beta.
-Steve
As I have said before GREAT PRODUCT. Is there a way to take the outstanding reports shown in the gui and simply drive them as is to a file or sharepoint?
Bill,
Currently there is not a way to do that, but it is a great suggestion. I will put it in my backlog and see when we could get it into a future beta.
-Steve
Steve,
Good work. I have just downloaded and started playing with it. It’s really helpful and handy specially for naïve DBAs who doesn’t know how to play with DMVs. As a production DBA I always want to see the current running queries and their execution plans. I use the following SQL to get the details; I would love to see if this can be integrated with the tool.
select *,percent_complete,OBJECTID,dbid,SESSION_ID,blocking_session_id,wait_time,wait_type,( SELECT TOP 1 SUBSTRING(s2.text, statement_start_offset / 2, ( (CASE WHEN statement_end_offset = -1 THEN (LEN(CONVERT(nvarchar(max),s2.text)) * 2) ELSE statement_end_offset END) – statement_start_offset) / 2) ), (SELECT query_plan FROM sys.dm_exec_query_plan (plan_handle)) from
sys.dm_exec_requests s1 CROSS APPLY sys.dm_exec_sql_text(sql_handle) AS s2
Cheers,
Yusuf.
Thanks for the great suggestion. Beta 9 of the Database Health Monitor will include a report called “Active Queries” that is based on the query you provided. Thanks!
This was included in Beta 9 (a while ago) and is part of the final released product.
-Steve
Hi Steve – Great product, but unfortunately, version 8.1 has expired and the download link from the software does not seem to be working. Are you releasing a new version anytime soon, or if not, can you just please take the expiry checking out?
Sorry for the delay. Beta 8.2 has been released with time out message removed.
See http://databasehealth.com/download/ for the latest download.
I’ve been working with the tool now since beta 5 and I must say great improvements! When is beta 8.2 or 9.0 to be released?
Keep up the good work!
Sorry for the delay. Beta 8.2 has been released with time out message removed.
See http://databasehealth.com/download/ for the latest download.
Hi, I have using your app. and find it very useful. It has timed out and will not run. Is there a way to continue to use it?
Sorry for the delay. Beta 8.2 has been released with time out message removed.
See http://databasehealth.com/download/ for the latest download.
Sorry for the delay. Beta 8.2 has been released with time out message removed.
See http://databasehealth.com/download/ for the latest download.
Nice Monitor!!! For some reasons, after the upgrade, when i click on “connections” It’s shows no connection to the database. Even though i’m connected. Also, when i click the restore chain, ‘show script’ . Nothing was showing up. Advice pls.
Please email support questions to Support@DatabaseHealth.com. I can help get you questions answered there.
thanks,
Steve Stedman
How do we register for the Beta 10?
Follow this link to support Beta 11 and to get a license key for Beta 10.
http://igg.me/at/DatabaseHealth11
-Steve Stedman
To get the released product license key, you just need to register for my mailing list.
its really helpful ,it would be great if it had option to export the report. hope you ll consider it
Most of the charts can be exported by right clicking and selecting copy to the clipboard.
Hi Steve….OUTSTANDING PRODUCT and getting better every day…..have downloaded the January 2015 version and installed. But when I launch it says Beta Version Expired go to the site and get a more recent version…..did that and same version downloads….right now nothing is working…..should I down level to 9.3 to get back into a running state?
Bill,
The new version, Beta 10.1 is now available. Sorry for the delay.
http://databasehealth.com/download/
-Steve
Love the tool. It is all of the features I like from SSMS and scripts I’ve accumulated from all over the place all thrown into 1 nice fancy tool. Thanks a bunch for it.
I did find one potential bug though. If you pick a SQL instance, click on “Server Connections” then double-click on a database, it brings you back to the “Server Health” page (the very top item on the navigation pane). I expected this to bring me to the “Real Time -> Connections” on the database. Also, having a “back” button (or hotkey) would be an awesome feature. So if I start clicking through all sorts of things in the information view then want to go back I don’t need to re-hunt for what the previous window was.
That being said, for a free tool, this is AMAZING. I love the tool. In the next few weeks, I am going to be testing the “Historic” and “technical debt” features on test.
Thanks for the feedback. I will take a look at the potential bug.
The 90 day expiration has been removed now that the product is out of beta.
No more beta, it is however still free.
Hi there. Just installed your application. So far it looks amazing.
I have two questions. My index fragmentation task is running for the past 5 hours. Is this normal? Programa is not responding
Second question is if there is any reason i never got any active queries showing.
Thanks and good job
The Index Fragmentation report is the slowest report in the entire product. 5 hours is a bit unusual. Can you email how big are your biggest tables in the database?
I downloaded the product and under the real time – table size th esize is correct but the row count is wrong… I have 46M rows but the report show 140M rows… can you please explain?
Dear Steve,
Can we also have the option to generate script to fix the index fragmentations like the way we have the script to fix the statistics.
Thanks,
Javeed
Splinded Tool I just found it really fulfills our need to monitor our inventory, nice work
Just found this tool.. Excellent..
Is possible to add query in this tool to get deadlocks detail?..
If you look at the Blocking instance level report you can see details on what may be deadlocking.
Any plans for adding the Availability groups reports
Yes, that is in the plans, but not something that is ready to release yet.
Hello Steve,
Thanks for this wonderful tool.
I am able to see message in the quick scan report for a database that is offline, that there are no recent backups taken for it.
Can you please have this report exclude the databases that are offline?
Thank you
Javeed
Please what append SchemaDrift??? Please need SchemaDrift.
Thank You.
Sorry, due to limited resources, I had to focus my time on Database Health. Schema Drift is no longer available.
Hi Steve,
could you reply?
when starting Database Health Monitor – i get popup error message:
Microsoft.NET Framework
Unhandled exception has occurred in your application. If you click Continue, the application will ignore this error and attempt to continue. If you click Quit, the application will close immediately.
Access to the path ‘C:\Users\test_user\Documents\dbHealthSettings.xml’ is denied.
I checked permission – it is ok.
Details of message:
See the end of this message for details on invoking
just-in-time (JIT) debugging instead of this dialog box.
************** Exception Text **************
System.UnauthorizedAccessException: Access to the path ‘C:\Users\testuser\Documents\dbHealthSettings.xml’ is denied.
at System.IO.__Error.WinIOError(Int32 errorCode, String maybeFullPath)
at System.IO.FileStream.Init(String path, FileMode mode, FileAccess access, Int32 rights, Boolean useRights, FileShare share, Int32 bufferSize, FileOptions options, SECURITY_ATTRIBUTES secAttrs, String msgPath, Boolean bFromProxy, Boolean useLongPath, Boolean checkHost)
at System.IO.FileStream..ctor(String path, FileMode mode, FileAccess access, FileShare share, Int32 bufferSize, FileOptions options, String msgPath, Boolean bFromProxy, Boolean useLongPath, Boolean checkHost)
at System.IO.StreamWriter.CreateFile(String path, Boolean append, Boolean checkHost)
at System.IO.StreamWriter..ctor(String path, Boolean append, Encoding encoding, Int32 bufferSize, Boolean checkHost)
at System.IO.StreamWriter..ctor(String path, Boolean append, Encoding encoding)
at Microsoft.VisualBasic.FileIO.FileSystem.WriteAllText(String file, String text, Boolean append, Encoding encoding)
at DatabaseHealth2.MyXmlSettingsFile.Reload()
at DatabaseHealth2.MyXmlSettingsFile..ctor()
at DatabaseHealth2.MainForm.Form1_Load(Object sender, EventArgs e)
at System.Windows.Forms.Form.OnLoad(EventArgs e)
at System.Windows.Forms.Form.OnCreateControl()
at System.Windows.Forms.Control.CreateControl(Boolean fIgnoreVisible)
at System.Windows.Forms.Control.CreateControl()
at System.Windows.Forms.Control.WmShowWindow(Message& m)
at System.Windows.Forms.Control.WndProc(Message& m)
at System.Windows.Forms.Form.WmShowWindow(Message& m)
at System.Windows.Forms.NativeWindow.Callback(IntPtr hWnd, Int32 msg, IntPtr wparam, IntPtr lparam)
It appears that the user “test_user” doesn’t have access to the config file. ‘C:\Users\test_user\Documents\dbHealthSettings.xml’
1. In the backup status report, it would be nice to see the “state” of the database to understand why the database was not backed up i.e. is it offline/suspect/restoring mode? Also it would be nice to know if the server is a primary / secondary.
2. ErrorLog report with severity 19 to 25 in past 24 hours would be helpful too.
3. You have server inventory report, perhaps we can also have a database inventory report too and if you could store the database size info over period of time, you could tell when the disk will be full if it keeps growing like this for capacity planning.
4. A single report for available disk space on all my servers with configurable threshold, red, yellow or green. e.g. Server A, Drive E is Red meaning available disk space is below 90%
I am old school so like to read my newspaper (reports) every morning to know whats going on in my SQL world:-)
Thank You,
Bo Sharma
Bo – Thanks for the details. I will see what I can do, those are some great suggestions.
-Steve Stedman
Congratulations on this great tool.
Marc – thanks for the feeback, I appreciate it.
-Steve Stedman
Awsome, I love it, thanks.
I hope that I’ll follow you on Linkedin, but i don’t find you
Here is a link to my linked in profile.
https://www.linkedin.com/in/stevestedman/
Thanks for the latest update Steve.
Looking forward for any new features and improvements.
13:30:34 : compatibilityLevel = 120
Object reference not set to an instance of an object.
showNoChartPanelWithParamsForDatabase section 1
at System.Environment.GetStackTrace(Exception e, Boolean needFileInfo)
at DatabaseHealth2.DebugMessages.Send(String message, Int32& level)
at DatabaseHealth2.ReportBaseClass.HandleException(Exception& ex, String details)
at DatabaseHealth2.NoChartReport.showNoChartPanelWithParamsForDatabase(String numColumns, String noneFoundMessage, String parameter1, Boolean addToolbar)
at DatabaseHealth2.QuickScanReport..ctor(MainForm& mainFormIn, Database& database)
at DatabaseHealth2.MainForm.Timer1_Tick(Object sender, EventArgs e)
Do you accept donations via PayPal etc?
Hi Steve, great tool!!, so i’ve read the page and i saw that the graphics are new…, so, i’ve downloaded the last version of tool, i seeing a new fonts…but the graphics are old version, i just want to know if i have a earlier version…
Regards!!
Thank you a lot for this excelent application. I loved the “missing indexes” and “Statistics” section, it helps me to save time and efford for the weekly maintance.
Best Regards
Hello, I congratulate you for this very good tool, I would only recommend an option to send emails when a performace event occurs, for example some deathlock or a very heavy query, greetings.
I have been using Database Health Monitor during parallel tests of onPremises and AWS databases.
Two days ago we moved all onPremises databases to AWS AlwaysOn.
We are a small nonprofit organisation that among other things is involved in the fight against Human Trafficking, so Database Health Monitor played a big part in our financial ability to migrate to the Cloud.
The DBhM database itself is Clustered and myfront end client is connected to the AlwaysOn Listener and also to both nodes for sake of temporary curiosity. Longterm I will remove the AlwaysOn Listener from DBhM and perform daily monitoring mostly of the Primary node.
Thank you Steve, on the behalf of the victims of Human Trafficking and the other people that we assist.
Hello,
Great tool! thank you. i have requested a new code cause the old one expired but still have not received it.Its been almost 10 days. Hope i receive it soon.
Thanks again
Christos,
Since the December 2019 release of Database Health Monitor, there is no need to wait for the code by email. You can register for the code and immediately get one from the registration dialog.
-Steve Stedman
Is there a way to get a registration key for this direct from you as I have to install this on servers with no internet access and I cannot install it on the company laptop , very secure place where I work.
Peter – If you register on any computer, you can then copy and paste the email address and registration code from the xml config file located in your documents directory.
-Steve
Hi Steve,
This is a great tool, thanks! I’m new using mssql, and I would like to know if there is a link where I can understand the reports? and what actions to take when I get too many red bars? for example, in the main dashboard I have the report one time used queries, here I get too many red bars, but I don’t know what actions should I take, also in the “waits” report, is there a threshold, so I can know when is it ok or need attention?
As I mentioned before, I’m new working with SQL Server, and I’m still learning on my own.
Thanks in advance.
Enmanuel
Thanks for the feedback. As far as a link to understand the reports, that is everything on databasehealth.com. The whole site is designed as the docs on the reports.
We connect to Azure SQL Server Managed Instances. In the Connect to Server dialog, in the Authentication drop-down, we select Azure Active Directory – Password. Can this functionality be added to Database Health Monitor?
Hi Steve,
It’s a great tool.
Is it possible to add a connection from an instance with a different portnumber then the default portnumber.? When yes, how you do that?
I overlooked that on the connect page. Let me look into adding that for you.
-Steve Stedman
I am not getting any code when I click on Requested Updated License code. (The window goes to not “responsing mode” and then returns to normal but nothing happens.)Please advise.
Please give it a try again. We had a problem with the website for a couple days that prevented new registrations from coming in. It is fixed now.
Or it says registratino failed , please try again later
Give it a try again. We had a problem with the website for a couple days that prevented new registrations from coming in. It is fixed now.
Hi there, for a while when going to Real Time-> Fragmentation
the application crushes, or stops responding, i tried on different PC, an various databases, any idea?
I have registered for the newsletter but not received a license key
Hi Steve,
Sorry you have not received your license key yet.
Please see this post to see if it will help. I have also sent you an email regarding this. Please reach out if you have further difficulty.
http://databasehealth.com/registration-form/
Getting an error when clicking on “Quick Scan”:
2:06:28 : compatibilityLevel = 150
Object reference not set to an instance of an object.
showNoChartPanelWithParamsForDatabase section 1
at System.Environment.GetStackTrace(Exception e, Boolean needFileInfo)
at DatabaseHealth2.DebugMessages.Send(String message, Int32& level)
at DatabaseHealth2.ReportBaseClass.HandleException(Exception& ex, String details)
at DatabaseHealth2.NoChartReport.showNoChartPanelWithParamsForDatabase(String numColumns, String noneFoundMessage, String parameter1, Boolean addToolbar)
at DatabaseHealth2.QuickScanReport..ctor(MainForm& mainFormIn, Database& database)
at DatabaseHealth2.MainForm.Timer1_Tick(Object sender, EventArgs e)
Happens for 2 instances. 8 other instances have no problems.
Thanks for submitting that Richard. I am looking into the issue now.
-Steve Stedman
Hi
When I install on a server without internet connection it is not possible to get a License code
When I close The License code-window the application End.
If you register Database Health Monitor on a computer that does have internet access, then copy the DBHealthSettings.xml from your computer with internet access to the server that does not have access. that should work.
-Steve Stedman
Hello Steve
I have a question to which I cannot find a clear answer….
It’s about SQL 2012 Standard Edition: How much RAM is supported?
Can I allocate 200GB RAM to an instance and it will be used? As I see it, I could even allocate 2TB RAM in a SQL Standard Edition.
Thanks a lot and great job with your tool!
Fabian
Fabian, Here is a link to a blog post outlining the memory limits of SQL Server.
https://stevestedman.com/2022/01/sql-server-memory-limits/
The Memory limit on SQL Server 2012 standard edition is 64GB. SQL Server will use a bit more than that, but generally the database buffer pool is limited to 64MB.
If you want to use more memory, you could upgrade to SQL Server 2014 (standard edition) and get 128GB of buffer pool space. Another option is to upgrade to Enterprise edition (expensive edition) if you need more momory.
I hope this helps.
-Steve Stedman
Hi Steve. Will the tool work with Azure SQL Database? Either hyperscale or not?
thx
The tool does not work with Azure SQL databases. It does work great with SQL VM’s on Azure, or on Amazon RDS SQL instances.