Performance Dashboard
The performance dashboard is the main overview page in Database Health Monitor. The is the main screen that you see once connected to one or more databases with Database Health Monitor.
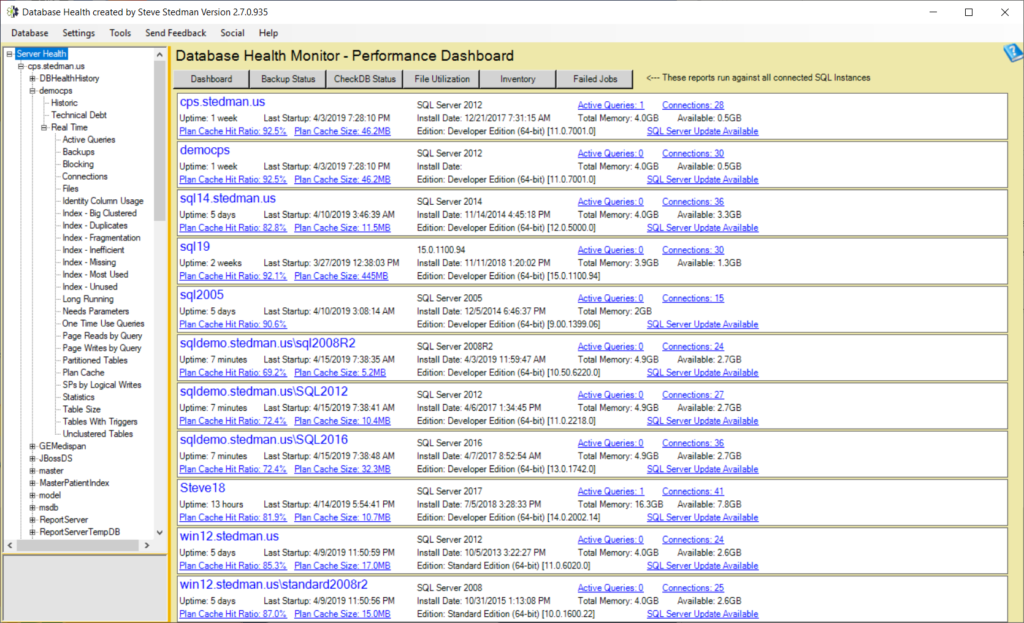
From here you can access the database level and server instance level reports available in Database Health Monitor.
Questions relating to the Database Health Performance Dashboard
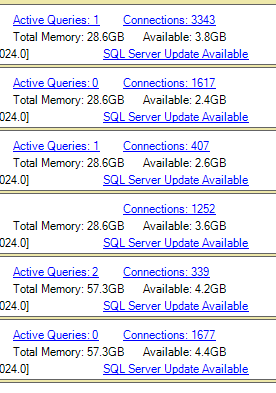
Question: What does connections show, I understand that it means how many sessions or which sessions are connected to a database but there is the kicker. When I click on a session it comes back saying no data available for this session, does that mean its jut a process that was never released by the code? Below is a picture of what I have currently and one of the servers has over 1000 sessions but like only 1 active query… please let me know your thoughts and how you would address.
Answer: I see that all the time where the number of connections is high, but the active queries is very low.
This is typically caused by an application that is holding connections open. For instance, I have 10 tabs open in SSMS that will show up as to connections (plus one more for SSMS), but only those tabs that are actively running queries will show up in the active queries. This is common with web servers or other applications that do connection pooling, they will open a bunch of connections to the database to have the ready to use, but only a few of them will be used. If you click on the connections link, It will take you to a pie chart showing which databases have the most connections, from there you can click on the pie chart to drill down to the database and find out what login, and sometimes what application is taking up those connections.
Enroll Today!


Steve and the team at Stedman Solutions are here for all your SQL Server needs.
Contact us today for your free 30 minute consultation..
We are ready to help!
 Download this page in PDF format