Blocking By Hour of Day
The Blocking by Hour of the Day report is one of the instance level reports available in Database Health Monitor.
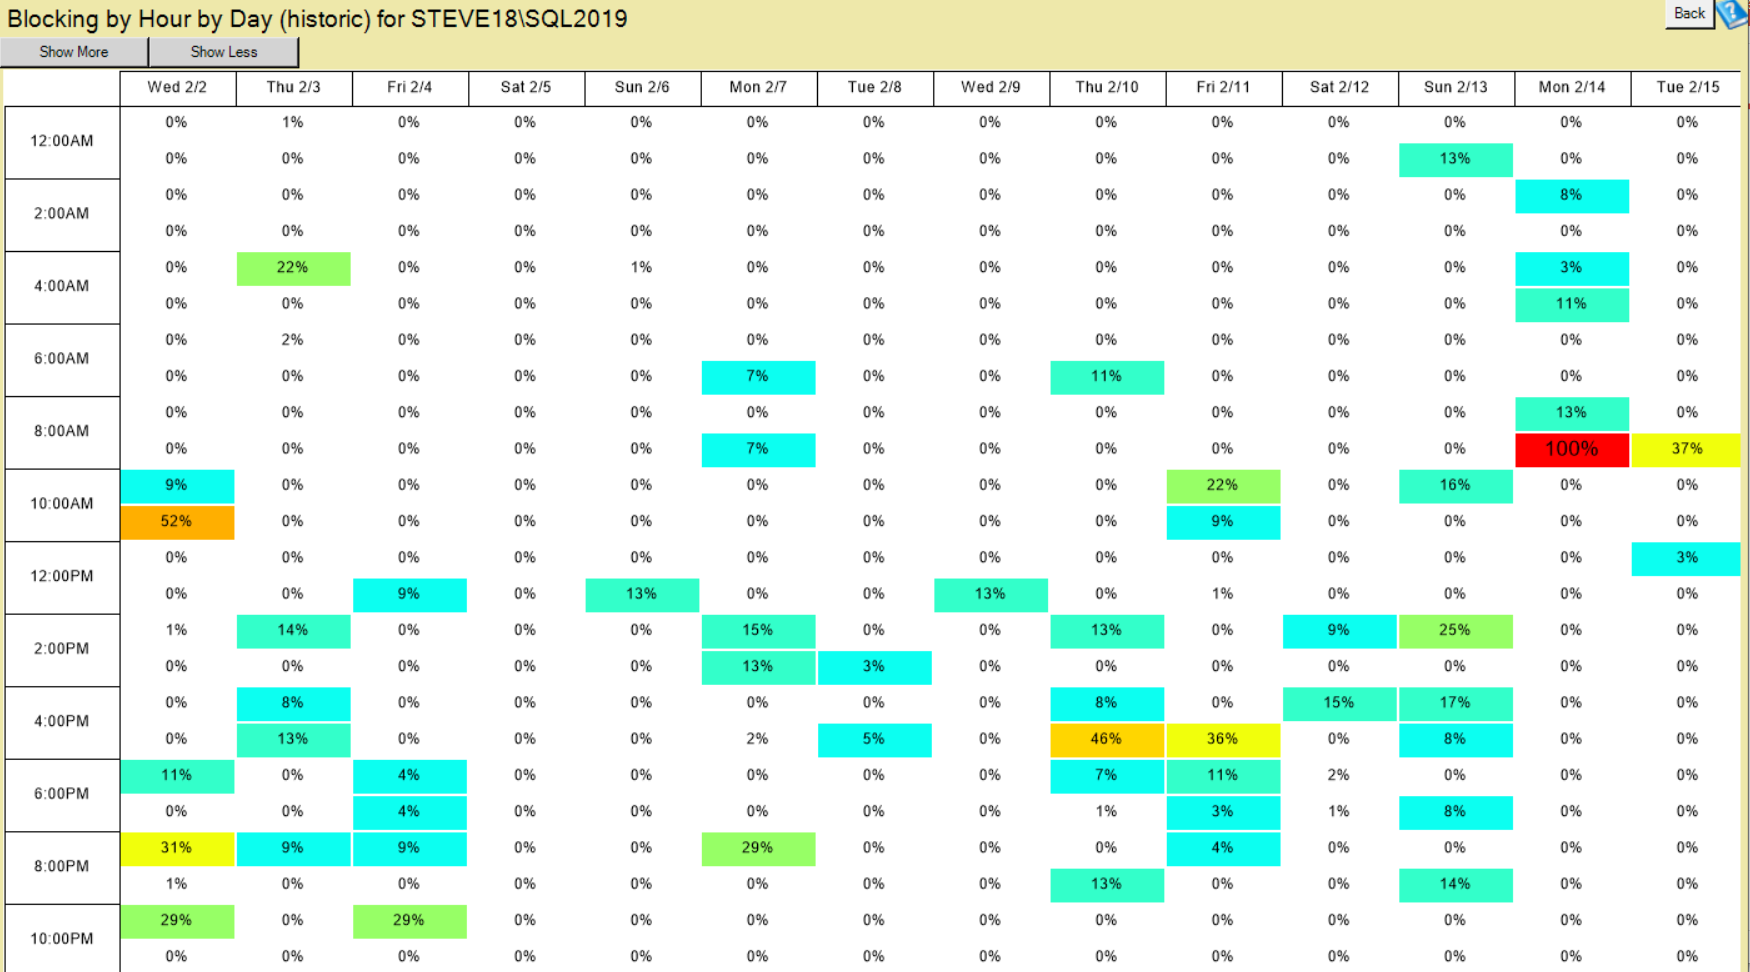
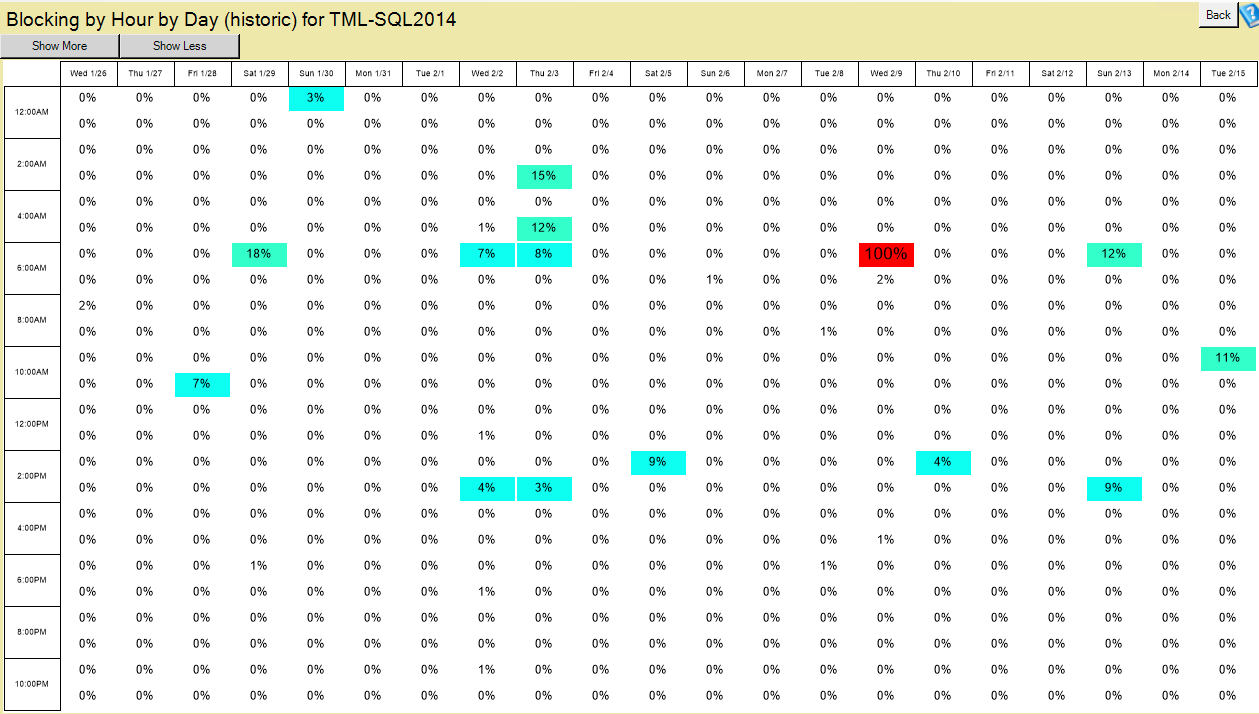
Important Note: The blocking percentages are relative for the date range shown. We find the hour that has the most blocking and use that as the maximum and all of the percentages are calculated based on the percentage of the maximum blocking amount. 100% is shown for the hour that has the most blocking, not indicating that we are 100% blocked for that hour. 50% shows that that hour had half the blocking that the biggest blocking hour had. Also 0% does not mean that there was no blocking at all, it just indicates that if there is blocking that it is less that half of 1% of the maximum blocking amount.
This chart is used to find the hours of the day that blocking occurs the most. If you are seeing trends here on a day to day basis you may want to do additional tracking during those busy hours.
This is one of my favorite reports to find trends that are perhaps related to maintenance jobs or other scheduled items, as well as to find if there is blocking during the busiest times of the data that the system is being used.
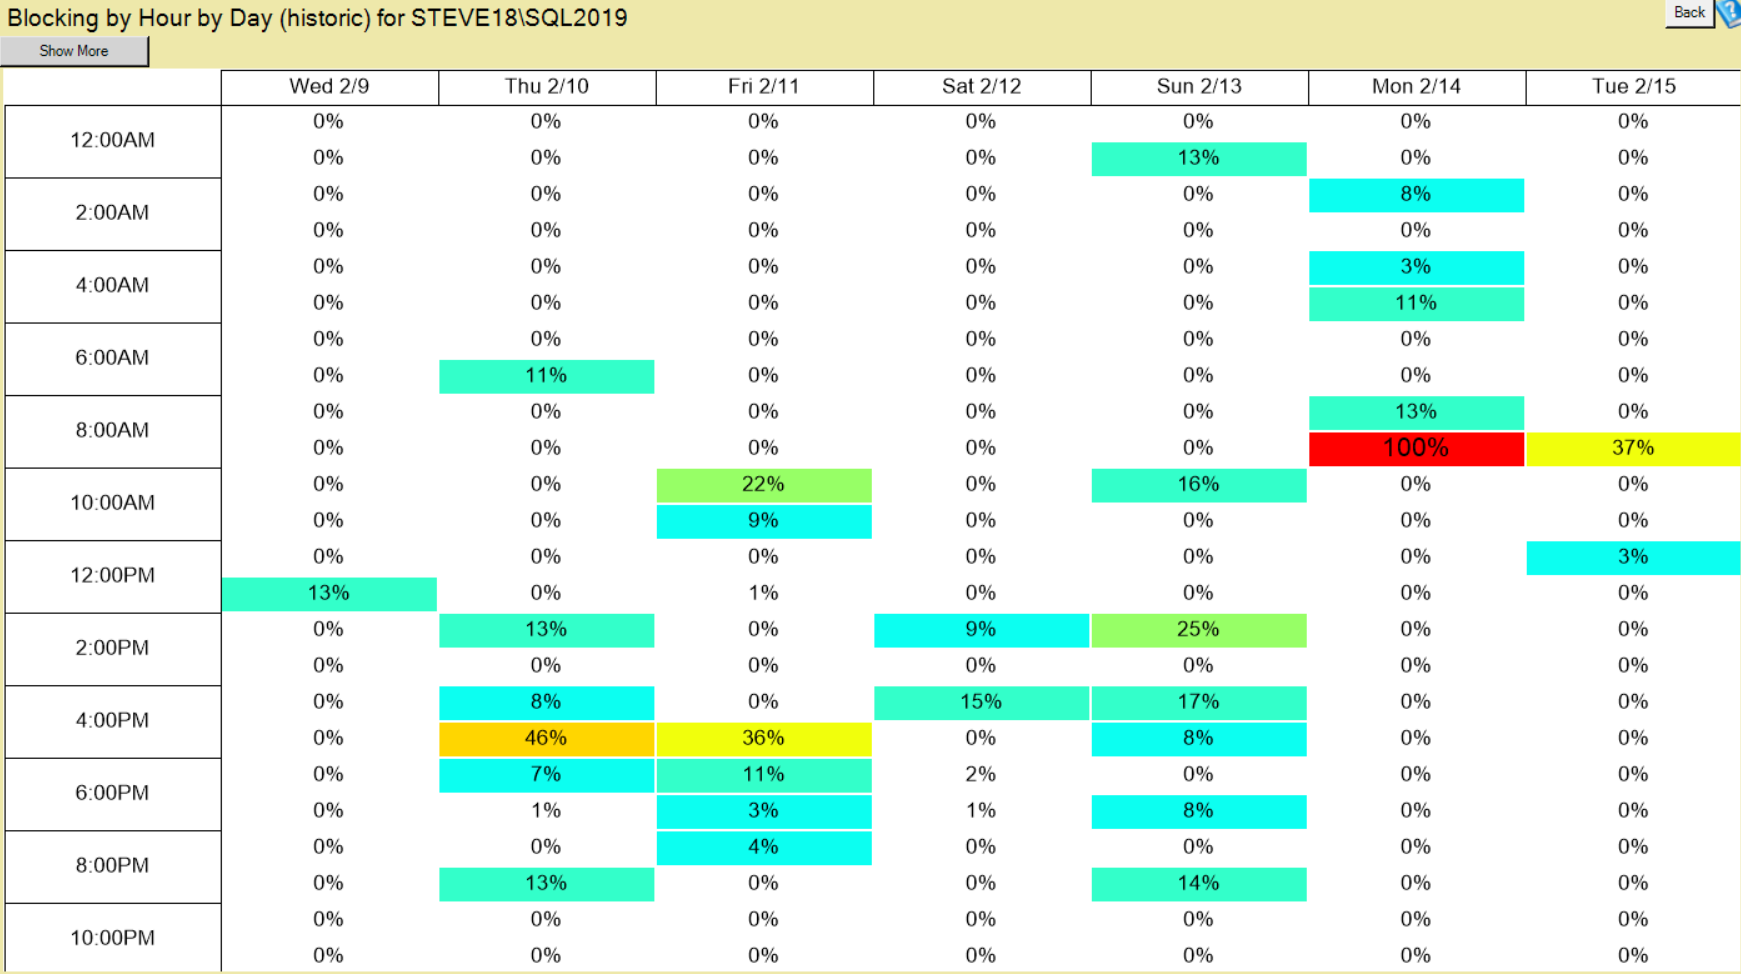
By default the report shows you the last 7 days as columns and each hour of the day as a row with the amount of blocking for that hour shown in the block. The show more or show less buttons on the top will allow you to go back and look at 2, 3 or ever 4 weeks of blocking history looking for trends.
To use the Blocking by Hour of Day report, you need to have Historic Monitoring enabled for your SQL Server instance.
Enroll Today!


Steve and the team at Stedman Solutions are here for all your SQL Server needs.
Contact us today for your free 30 minute consultation..
We are ready to help!
 Download this page in PDF format