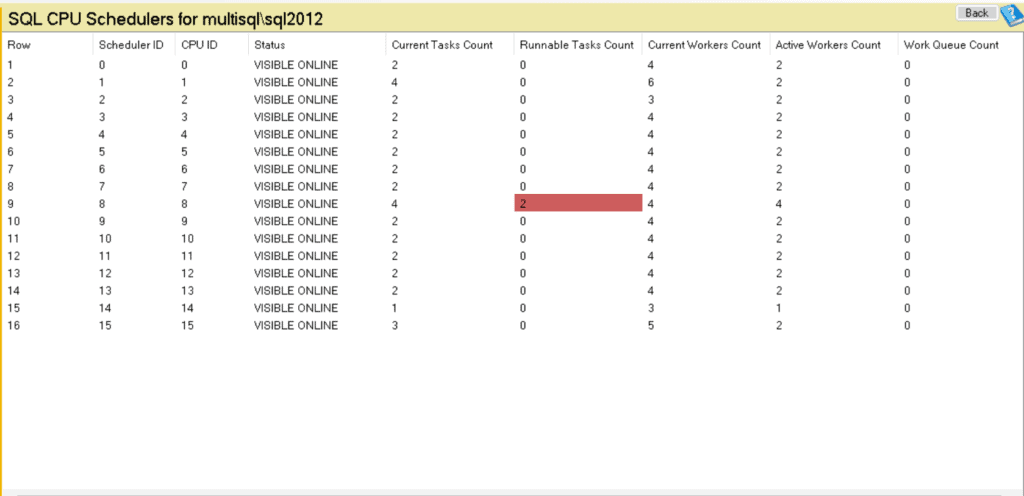
SQL CPU Schedulers Report
The SQL CPU Schedulers report is designed to help monitor CPU usage on your SQL Server. By examining the Runnable Tasks Count for each scheduler, you can quickly assess if the server is under CPU pressure—a condition that could indicate bottlenecks impacting the performance of your database queries and workloads.

Key Metrics Explained
This report uses data from sys.dm_os_schedulers to provide real-time insights into CPU scheduling, including the number of tasks, workers, and CPU activity. Below is a breakdown of each column in the report:
- Scheduler ID: Identifies the scheduler. Each scheduler manages a CPU or core in SQL Server, helping distribute workload processing.
- CPU ID: Indicates the specific CPU associated with this scheduler.
- Status: Shows the current status of the scheduler, typically indicating if it’s online or offline.
- Current Tasks Count: Reflects the number of tasks currently being processed by the scheduler.
- Runnable Tasks Count: Displays the number of tasks waiting for CPU resources. This is a crucial indicator of CPU pressure:
- Yellow (1 runnable task): A warning level, indicating some CPU contention.
- Red (2 or more runnable tasks): Indicates significant CPU contention, suggesting a potential bottleneck that requires immediate investigation.
- Current Workers Count: Shows the number of worker threads currently assigned to the scheduler.
- Active Workers Count: Displays the number of actively executing worker threads.
- Work Queue Count: Indicates the number of tasks waiting in the work queue for assignment to an available worker.
Interpreting the Results
High values in the Runnable Tasks Count column (highlighted in Yellow or Red) indicate CPU pressure:
- Yellow (1 runnable task): Suggests that CPU resources are nearing full utilization, and the system may experience delays in task execution. Monitor these schedulers to see if additional load pushes them into red.
- Red (2 or more runnable tasks): Signifies critical CPU contention, which may cause significant delays in task processing. In this case, SQL Server might be unable to keep up with the workload, leading to longer query response times and performance degradation.
If you consistently see schedulers in yellow or red, consider reviewing your system’s workload and SQL Server configuration. You might need to investigate and optimize resource-intensive queries, examine the current server workload, or consider adding CPU resources.
Steps for Performance Optimization
To alleviate CPU pressure, consider the following:
- Query Optimization: Review and tune resource-intensive queries that could be consuming excessive CPU resources.
- Indexing Strategy: Ensure indexes are in place to reduce the workload on the CPU, minimizing full table scans.
- Server Configuration: Adjust SQL Server configurations to balance workload distribution more efficiently across CPUs.
- Parallelism Settings: Review settings like
MAXDOP(Max Degree of Parallelism) to optimize task distribution and reduce CPU contention. - Monitoring Tools: Use tools like Database Health Monitor to continually monitor CPU pressure and identify patterns in CPU usage.
Getting Help from the Stedman Solutions Team
The team at Stedman Solutions is here to help with your SQL Server needs. Get help today by contacting Stedman Solutions through the free 30 minute consultation form.