Reading SQL Server Trace Flags: Where to Look First
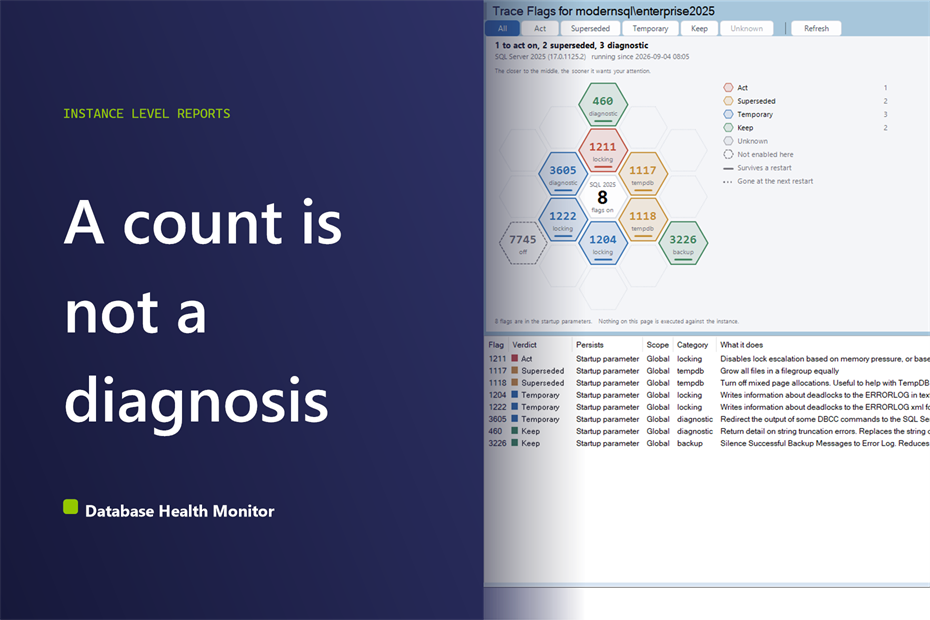
Open the Trace Flags report on any instance and you land in front of a hub ringed with hexagons, one for each of the SQL Server trace flags currently enabled. The hub also carries a number, and it's tempting to read that as the score. Don't. A count of flags says nothing about the health of an instance. Six flags kept on purpose beat a single forgotten 1211, and a total that lumps them together would only get that backwards. The number worth reading first isn't on the hub at all. It's how many of those flags disappear the moment the service restarts, because that fact comes with a deadline and the flag count never does.
How do I tell which SQL Server trace flags on an instance are still doing anything? SQL Server trace flags can't be judged by number alone. DBCC TRACESTATUS (-1) shows what's enabled, but whether a flag still changes behavior depends on the build, since flags like 1117 became defaults in later versions. Whether it survives a restart depends on the startup parameters, not DBCC TRACEON.
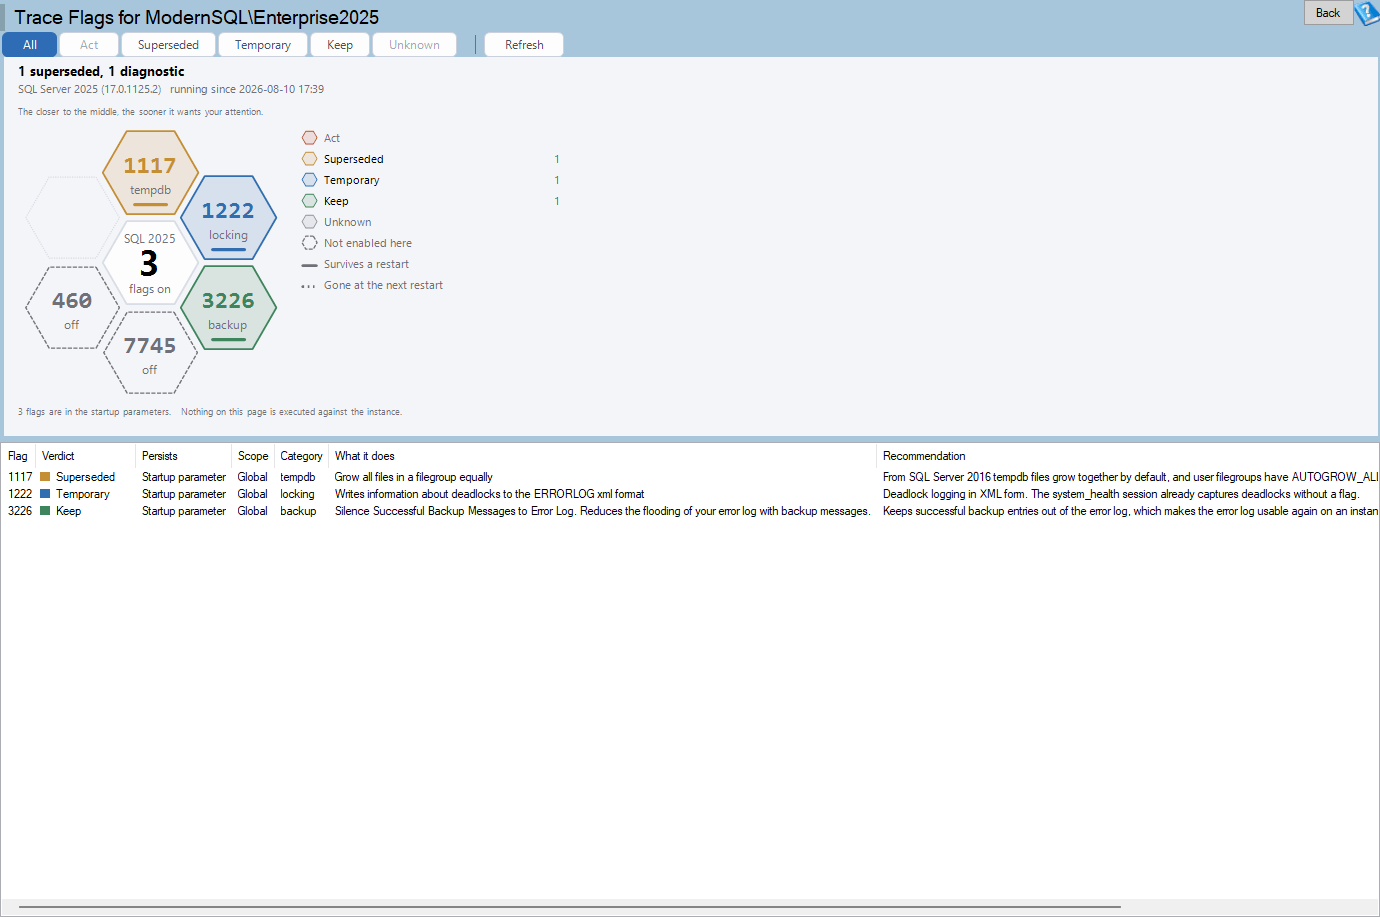
Trace Flags is one of the reports in Database Health Monitor. It runs against your own servers, and it takes about a minute to have this same screen open on one of them.
In this post
- Where to look first: the column with a deadline
- What it takes to see the full picture
- The five bands, and why the ring order matters
- A healthy reading of SQL Server trace flags
- A reading that needs action, and how to tell them apart
- The grid: where each column earns its place
- The drill-down: scripts instead of guesswork
- Where the report gets its answers
Where to look first: the column with a deadline
That deadline lives in two places at once: the Persists column in the grid, and a mark on the bottom edge of every hexagon in the chart. A solid bar means the flag has a +-T+ entry in the startup parameters, so it survives whatever happens to the service next. A broken bar means somebody switched it on at runtime with +DBCC TRACEON+, and it dies the moment the instance restarts, scheduled or not. No mark at all, or a dash in the grid, is an answer in its own right: +sys.dm_server_registry+ came back empty, most often because of a permissions gap, and the report would rather admit it can't tell than guess. That dash is not the same claim as Runtime only. One says the flag is about to disappear; the other says the report couldn't check either way.
Read that column before you read the band. A flag doing nothing on the current build is clutter, and clutter can wait another sprint. A flag about to vanish at the next patching window is a decision with a due date attached to it, and on the chart alone the two can look exactly the same.
What it takes to see the full picture
You'll find the report two ways: right-click a server in the tree and choose Instance Level Reports, then Trace Flags, or open Server Overview and look under Configuration in the report launcher panel. The page title names the server, so there's no ambiguity with more than one instance open at once.
The report degrades rather than refuses outright. There's no minimum SQL Server version: +DBCC TRACESTATUS (-1)+ has worked for a very long time, and the two extra reads behind the build and the startup parameters just fall back to an honest unknown where they can't run. +VIEW SERVER STATE+ is the one permission that actually matters, since that's what the startup-parameter read needs. Skip it, and every flag and its verdict still show up; what disappears is the answer to the restart question, and the page says so instead of leaving a blank column for you to misread.
Nothing here changes the instance on its own. Turning off a flag with +DBCC TRACEOFF+ affects the whole instance immediately, and editing a startup parameter means bouncing the service, so both belong in a change window somebody actually approved. The report's own job stops at writing the script and putting it on the clipboard.
The five bands, and why the ring order matters
Every enabled flag lands in one of five bands, and which band it lands in depends on the SQL Server version in front of it, not on the flag number alone. That's the entire reason the report reads the build before it labels anything. The same flag can be essential on one version and inert on the next, and a description accurate on both ends up useful on neither.
- Act: obsolete on this build, or actively dangerous, like a flag that can let one statement hold every lock the instance has
- Superseded: did real work once, and this build already does it for you
- Temporary: diagnostic output, right to run for a week, easy to forget for a year
- Keep: pulling real weight on the build you're currently running
- Unknown: enabled here and missing from the catalog, worth a question rather than a panic
The toolbar mirrors those same five bands, plus All, which is the default and the only button that's never greyed out. A band with nothing behind it on the current instance simply can't be pressed. Filter down to Act, and the hollow suggestion hexagons drop off the chart entirely, because someone narrowing the view to obsolete-and-risky flags isn't asking what else they could turn on.
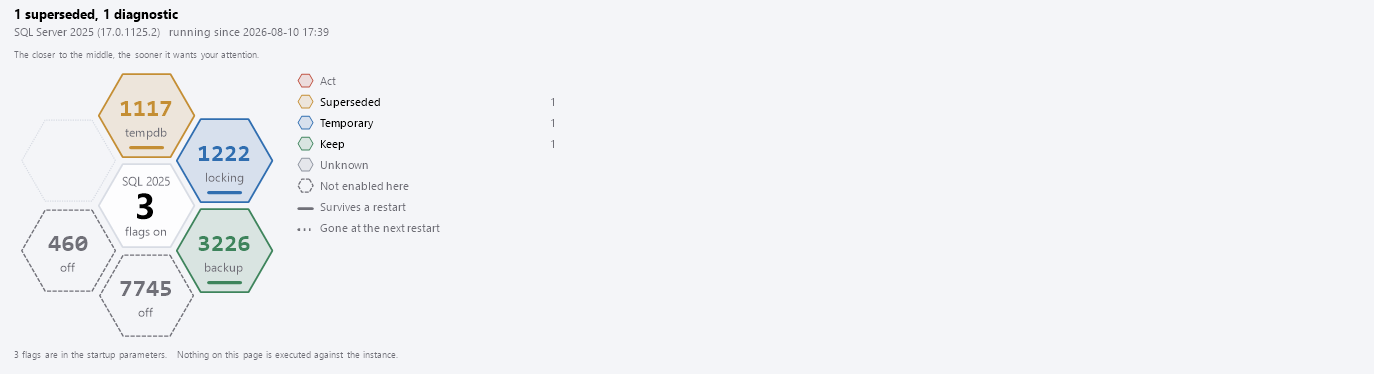
Superseded is the band that justifies reading the version at all. Trace flag 1117 is the clearest case. On SQL Server 2014, tempdb's files didn't grow together automatically, so somebody set the flag to force that behavior by hand. Later versions do it by default, so the identical flag today changes nothing. The hollow, dashed hexagons marked not enabled here are a different thing: flags plenty of other instances run on purpose that this one doesn't, drawn only while All is selected, and version aware the same way the bands are, since 1117 and 1118 only appear as suggestions on 2014 and earlier. They're labelled as options, described with their trade-offs, and the decision stays with you.
A healthy reading of SQL Server trace flags
The plainest healthy reading is also the most common one: nothing enabled at all. The hub reads zero, the ring holds only the hollow suggestions, and nothing on the page asks for a decision today. A close second is a short list of flags, each sitting in Keep, each with a solid bar showing it was written into the startup parameters on purpose rather than left there by accident. Both pictures say the same thing: somebody decided, and the instance still agrees with them.
Not every well-known flag ages the same way. Trace flag 4199 still lands in Keep on current builds, not Superseded, because it still changes behavior. Its recommendation points at the +QUERY_OPTIMIZER_HOTFIXES+ database scoped configuration as the safer place to make that call, but the flag itself hasn't been retired the way 1117 has. None of this means a superseded flag is doing harm, either. It just means the behavior it asks for already happens by default now, and the write-up spells out exactly which version made the difference.
No trace flags are enabled on this instance.
A reading that needs action, and how to tell them apart
A handful of patterns come up often enough to name, and each one points at a different next step.
| Pattern | What it usually means |
|---|---|
| Every flag reads Runtime only | Nothing has been written into the startup parameters yet, so an unplanned restart changes the instance's behavior with no one deciding it should |
| 1117 or 1118 on SQL Server 2016 or later | A tempdb setting carried forward from an older build. Harmless, but worth clearing out before someone else wastes time wondering if it still applies |
| A single flag sitting in Act | Usually trace flag 1211, or something left behind after a recovery step. Read about it before the next incident, not during one |
| A flag in Unknown | Not in the catalog, which usually means it was handed out by support for a specific situation, worth finding out which one it was |
The grid: where each column earns its place
The chart tells you where to look. The grid tells you what you're looking at. Flag and Verdict give the number and the band. Persists repeats the restart question in words instead of a bar. Scope reads Global or Session. Category groups flags by what they touch, from tempdb and locking to backup, optimizer work, diagnostics, replication, memory, IO, startup, security, availability, even query store. What it does and Recommendation are the two columns worth reading in full, because the second one is written against the build you're actually running rather than against SQL Server in general. Select a row and the matching hexagon highlights on the chart; click a hexagon and the row does the same in reverse.
There's no scope mark on the chart, and that's on purpose. A session scoped flag is visible only to the session that set it, and the only session in play here is Database Health Monitor's own connection, so scope can't actually vary from one hexagon to the next. Drawing a mark for something that never changes would just be decoration. It still shows up in the grid and the tooltip, where it costs nothing to display.

The drill-down: scripts instead of guesswork
Right-click any flag and the report writes a script instead of an opinion: a commented-out turn-off script, a commented-out turn-on script, and a copy of the two reads the whole page runs, so you can check its homework instead of taking its word. When a flag persists, the turn-off script always comes in two halves. Clearing it with +DBCC TRACEOFF+ only changes memory; leave the +-T+ sitting in the startup parameters and the flag walks straight back in at the next restart, which is the exact mistake this page exists to catch before it happens. Double-click a row, or a hexagon, and the same detail opens in its own window: band, description, scope, persistence, build and recommendation, together, above the scripts.
The report also points at where to go next. Configuration Values covers the +sp_configure+ settings that several trace flags have effectively been replaced by. Security Posture is where flags like 3625 and 4616 belong in a hardening review. Migration Planner covers which flags are worth carrying to a new server and which ones are worth leaving behind for good.
Where the report gets its answers
Four reads sit behind everything on screen: +DBCC TRACESTATUS (-1)+ for what's on and its scope, +SERVERPROPERTY('ProductVersion')+ for the build that decides Superseded, +sys.dm_server_registry+ for the startup parameters, and +sys.dm_os_sys_info+ for when the instance last started. The build number comes from parsing +ProductVersion+ instead of the newer +ProductMajorVersion+ property, which simply isn't there on anything older than SQL Server 2014 SP2. Skip that property and the effect is invisible until it isn't: an old instance reports no version at all, and every trace flag that should have moved to Superseded quietly stays in Keep instead. Nothing on this page gets written down anywhere; it reads, it labels, and it leaves the decision to you.
What to check on your own server
- Run DBCC TRACESTATUS (-1) and write down every trace flag it reports as enabled
- Check SERVERPROPERTY('ProductVersion') so you know which build any flag's behavior is being judged against
- Query sys.dm_server_registry for SQLArg values under the Parameters key to see which flags are startup parameters
- Note any trace flag with no persisted startup parameter, since it disappears at the next restart whether anyone plans for it or not
Try Database Health Monitor Today
It shows which trace flags on an instance still do anything on the current build, and which ones vanish the moment the service restarts. Database Health Monitor shows it on every instance you connect, in the time it takes to open the report.
Download Database Health Monitor and run the Trace Flags report against your own server. There is nothing to configure first, and you will know inside a few minutes whether it tells you something you did not already know.