Finding the Statement Inside a Loop in SQL Server
A nightly reconciliation job used to finish before anyone reached for coffee. Lately it clears six o'clock most Mondays, and nobody has touched the stored procedure behind it in months. Pull up the procedure and every statement looks reasonable in isolation. The slow part usually isn't a statement doing more work than before, it's one statement inside a loop, quietly running thousands of times while the rest of the batch runs once.
How do I find the statement inside a loop in a SQL Server stored procedure? A statement inside a loop runs far more often than the typical statement in the same procedure, function, or trigger, measured against that module's median execution count rather than the plan cache's call count. Query Store records executions per statement, and comparing statements from the same module over the same window is what exposes a hidden WHILE loop or cursor.
In this post
- The Ranking That Points at the Wrong Suspect
- The Number Everyone Reaches For, and Why It Lies
- Median, Not Average, Not the Plan Cache
- Finding the Statement Inside a Loop
- Reading the Chart
- Reading the Grid
- What This Needs From Your SQL Server
- What to Watch Out For
The Ranking That Points at the Wrong Suspect
The obvious first move, in Database Health Monitor or any tool like it, is to pull up whatever ranks procedures by total duration or reads, find the busiest one, and stare at it end to end. That's the right place to start, but it answers a different question. A procedure's total cost is every statement inside it added together, and a duration number at the batch level says nothing about which line is responsible. Query Store's own statement level pages have the opposite problem: they rank statements across the whole database, with the procedure's name sitting in a column, never lined up against the other statements from the same procedure. The same gap shows up in Plan Warnings and in Missing, the index suggestion report: both work one statement at a time, and neither tells you that statement is one of nine in the same procedure, or that it's the only one that matters.
The Number Everyone Reaches For, and Why It Lies
Executions is the number people eventually open Query Store to look at, and alone it tells you nothing. Forty thousand executions is unremarkable for a job that runs every night, and enormous for a statement that should only fire once at login. Ten microseconds run four million times is forty seconds of engine time that no ranked list sorted by cost per execution will ever put near the top. The count only becomes evidence once it sits beside the other statements from the same procedure, counted over exactly the same stretch of time. A statement running many times more often than its neighbors in the same batch is doing something structurally different, whether or not any single execution of it is expensive on its own.
Median, Not Average, Not the Plan Cache
The comparison point matters as much as the comparison itself. Average the executions of every statement in a module and a loop drags the number up with it, so the loop ends up measured against its own inflated effect and looks unremarkable. Use the smallest statement in the module instead and a different failure shows up: a line inside an IF branch that only runs down one code path will always look artificially rare next to the rest of the procedure. The call count sitting in sys.dm_exec_procedure_stats fails a third way, because it comes from the plan cache, which empties on a restart or an eviction, so it ends up comparing two different afternoons rather than one. The number that holds up is the module's own median statement by execution count, the typical line in that specific batch, over that specific window.
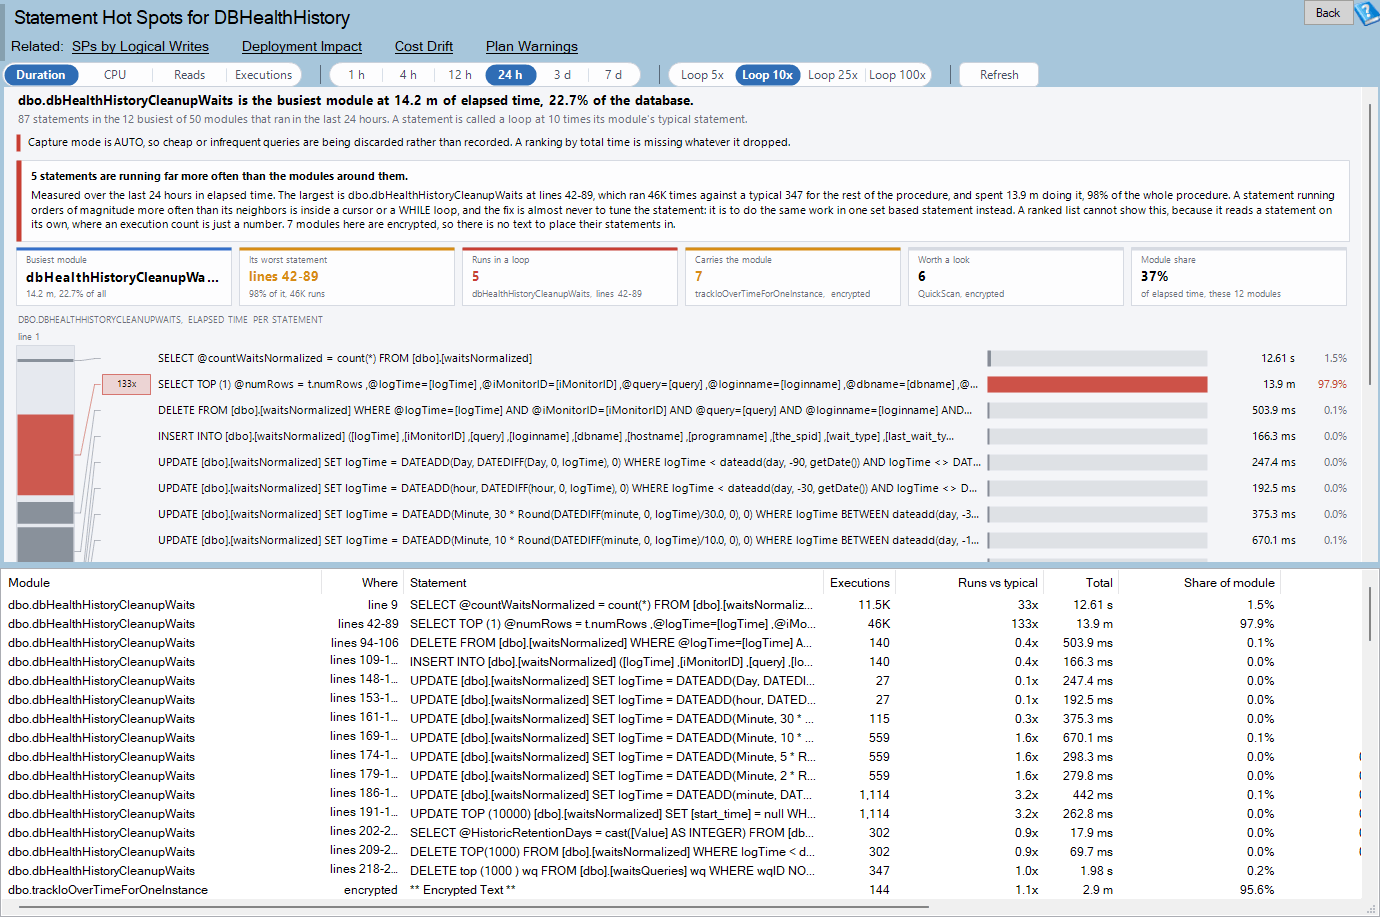
Statement Hot Spots is one of the reports in Database Health Monitor. It runs against your own servers, and it takes about a minute to have this same screen open on one of them.
Finding the Statement Inside a Loop
This is what the Statement Hot Spots report is built to answer. It takes the busiest procedures, functions, and triggers in a chosen window, ranked by whichever measure you pick, breaks every one of them apart into the individual statements Query Store measured inside it, and gives each one its cost, its share of the module's total, and the line or lines in the module's current text where it sits.
Two controls decide what you're looking at. One picks the measure, Duration, CPU, Reads, or Executions, and changes which twelve modules qualify, since a different measure ranks the database differently. The other picks the window, anywhere from one hour to seven days. A third control, the loop threshold, only changes how the existing numbers are colored, five times, ten times, twenty five times, or a hundred times the module's typical statement, so flipping it redraws instantly with no new read against Query Store.
Only twelve modules are shown, deliberately. Every statement of each qualifying module comes along, not just the expensive ones, so listing more than twelve procedures would just be page after page of statements you already know are cheap. The measure on the toolbar decides which twelve make the cut, so switching it can swap out the whole list, not just re-sort it.
A statement only earns the loop label on evidence, not on a hunch: its module has to hold more than one statement, the statement itself has to have run at least a hundred times, and it has to account for at least two percent of the module's cost. Below those floors a statement's run count is just noise. Above them, a badge on the statement names how many times its module's typical statement it ran.
Reading the Chart
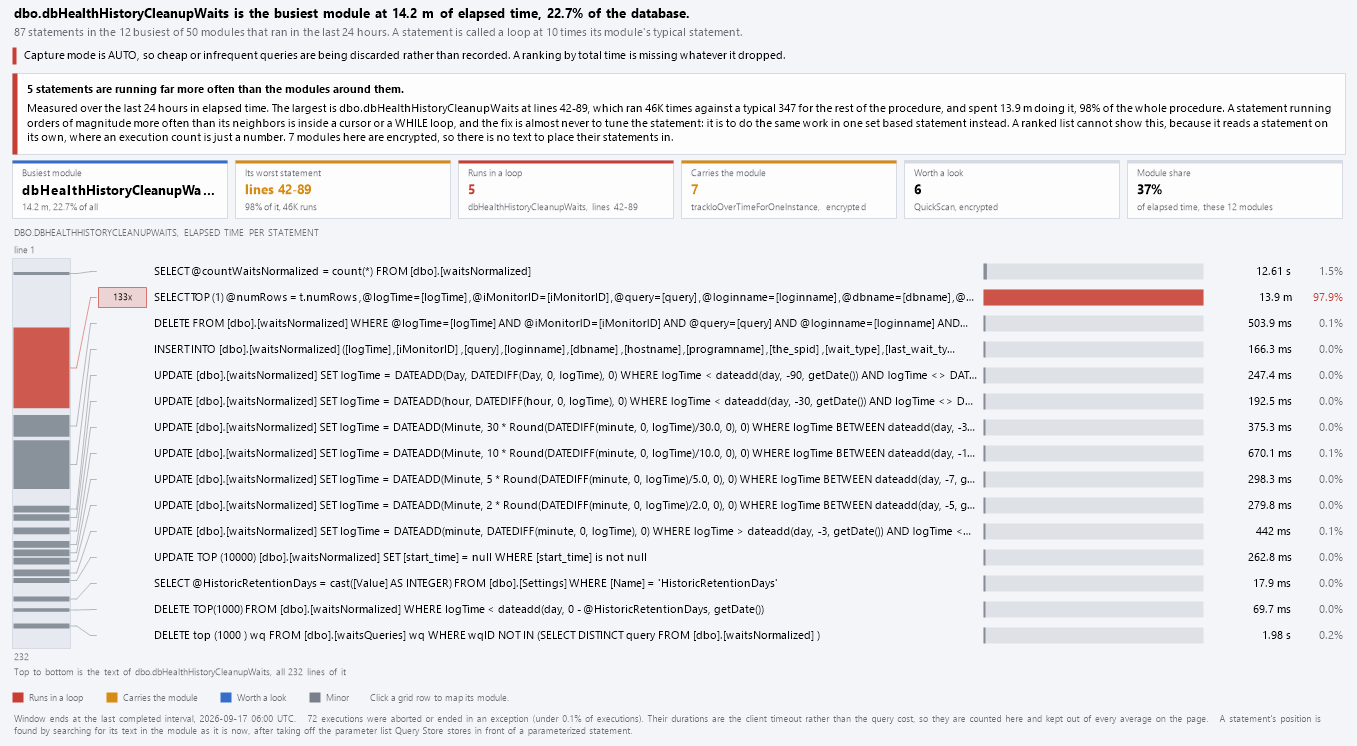
Click any row in the grid and the chart maps that row's module: a strip on the left drawn to scale from line one to the module's last line, with a colored mark for every statement Query Store measured, and a row on the right for each mark with its cost, its share, and a leader line back to where it sits in the text. Four expensive statements packed into the last twenty lines of a four hundred line procedure look nothing like the same four statements spread evenly through it, and the strip is what makes that visible at a glance. A row with no leader line is a statement that couldn't be matched to the module's current text at all, and the page says so rather than guessing.
- Red marks a statement running far more than its module's typical statement, the loop reading
- Orange marks a statement carrying sixty percent or more of its module's cost on its own
- Blue marks a statement worth a look, ten percent or more of the module
- Gray marks everything else, the minor statements
Reading the Grid
Under the chart is one row per statement, grouped by module in ranking order, and inside each module in the order the statements actually appear in the text. Alongside the cost columns, a Where column gives the line or lines in the module's current text, or tells you the statement is not found, encrypted, or has no text, and a Runs vs typical column is the same executions divided by the module's median that decided the loop reading in the first place. Hovering a row surfaces reads per run and rows per run too, useful for telling a loop that's cheap in CPU but expensive in logical reads from one that's cheap on every measure at once. Double-click a row and you get the statement's full text beside its figures. Right-click it and you can jump straight to the module's current definition, run Explain this statement for the reading in words, go to Plan Regressions if the statement has run on more than one plan, or copy the whole query behind the report to run yourself in SSMS.

What This Needs From Your SQL Server
None of this works before SQL Server 2016, because that's the version Query Store shipped in, and it only works on a database with Query Store turned on; master and tempdb can't turn it on at all. Reading the catalog views needs VIEW DATABASE STATE. Reading the module text that places each statement needs VIEW DEFINITION on top of that, and without it the costs and the loop readings still show up, just with no line numbers attached.
| Requirement | Why it matters |
|---|---|
| SQL Server 2016 or newer | Query Store did not exist before it |
| Query Store turned on for the database | The statement history lives inside Query Store |
| VIEW DATABASE STATE | Needed to read the Query Store catalog views |
| VIEW DEFINITION on the modules | Needed to place statements in the text; without it, costs and readings still show with no line numbers |
When Query Store itself is off, a Turn Query Store on button appears on the toolbar, because that's a setting, not a permission. A missing VIEW DEFINITION or VIEW DATABASE STATE grant is not something a button can fix; someone with the right access has to grant it.
- Executions and averages per plan per interval, from
sys.query_store_runtime_stats - The statement behind each plan and the module it compiled in, from
sys.query_store_planandsys.query_store_query - The statement's own text, from
sys.query_store_query_text - The module's current text, the one statements are placed inside, from
sys.sql_modules
Query Store also prefixes a parameterized statement with its own parameter list, something no procedure text actually contains, so that prefix gets stripped before the report goes looking for the statement inside the module. It matters most for the very statements you're hunting for, since they are parameterized precisely because their loop variable is a parameter to them.
What to Watch Out For
A statement can come back marked not found, and that isn't a bug, it's history. Query Store keeps a statement's numbers tied to the exact text it ran against, and if the procedure was altered afterward, even for something as small as a comment or a different literal, the old text is gone and the statement can't be placed anymore. If the same statement text appears twice in one module, it's placed at the first copy, because Query Store keeps one set of counters for both occurrences, not two. An encrypted module has no readable text at all, so its strip stays empty while its statements still get listed with full costs. A module that's been dropped keeps its statements in Query Store with nowhere left to place them, so it drops out of the report entirely.
An empty result usually means one of two things: the window is too short to have caught anything running inside a procedure, function, or trigger, or the application is sending its statements to the database directly instead of wrapping them in one. Neither is a report problem; both are answered by widening the window or checking how the application connects.
The fix for a loop was never tuning the one statement inside it. It's moving the work into a single set based statement instead of a hundred thousand round trips through the engine.
That's why a cheap statement caught by the loop reading is not a false alarm. A statement that costs almost nothing per run can still be the whole problem once it's counted that many times.
Once you've found the statement, the next question is usually whether its own cost is drifting or whether it's always run this way. Is This Query Slower Than Normal? Ask Its Own History covers comparing a statement against its own past rather than against an arbitrary threshold, which is exactly what a newly found loop needs next.
What to check on your own server
- Confirm Query Store is turned on for the database before you chase anything else
- Grant yourself VIEW DEFINITION on the procedures, functions, and triggers you plan to investigate
- Query sys.query_store_runtime_stats for a suspect procedure and list its statements with their execution counts
- Compare each statement's executions against its module's median statement, not the average or the plan cache's call count
- Flag any statement running far more than that median as a loop candidate, whatever its own cost looks like
Try Database Health Monitor Today
It finds the one statement running thousands of times inside an otherwise ordinary procedure, before that procedure's slow reputation becomes yours to explain. Database Health Monitor shows it on every instance you connect, in the time it takes to open the report.
Download Database Health Monitor and run the Statement Hot Spots report against your own server. There is nothing to configure first, and you will know inside a few minutes whether it tells you something you did not already know.
Related reading: msdb Is Too Big? Here's What's Actually Filling It. If backup history and job history are quietly filling msdb on that same server, this report breaks the growth down table by table and shows how many days of history each source is actually holding.
Related reading: Who Can See SSRS Reports? Check Broken Inheritance. Covers how to audit SSRS role assignments, find the reports that broke inheritance from their folder, and spot Content Managers nobody remembers granting.