Is a SQL Server Query Regression Statistically Significant?
A query used to take forty milliseconds. Now it averages ninety. Somebody wants to know who broke it. The dashboard shows the jump in red. That settles nothing. Before anyone touches an index, ask the real question: is this a SQL Server query regression statistically significant, or is the query just behaving the way it always has?
Is a SQL Server query regression statistically significant, or is it just noise from Query Store? A SQL Server query regression statistically significant by Change Significance's test has a change of three or more standard errors beyond the query's own run-to-run variation in Query Store, measured with stdev_duration or stdev_cpu_time across enough executions on both sides of the window. Below three, the change could be chance, however large its percentage looks.
Database Health Monitor's Change Significance report exists to answer that question directly. Every comparison report ranks changes by size. Forty milliseconds to ninety looks the same on all of them. It looks the same whether the query ran two million times on each side of the line, or only four. In the second case, there is nothing there. Tuning it burns an afternoon on a query that never really changed.
The number everyone reaches for first is the percentage. A query that doubled feels urgent. One that slipped two percent feels like nothing. Both instincts are wrong often enough to matter. A query that ran forty thousand times can be genuinely broken at two percent. A query that ran four times can double from nothing but luck.
In this post
- Percent Change Is Not Evidence
- What Makes a SQL Server Query Regression Statistically Significant
- Reading the Funnel Plot
- The Grid Underneath, and What's Worth Fixing
- Where This Fits Among the Other Reports
- Requirements and Where to Find It
- When There's Nothing to Test Yet
Percent Change Is Not Evidence
A regression can be perfectly real and still not matter much. A query that slipped two percent after forty thousand executions is real, no argument. If it only costs a few seconds a day, though, it isn't the fire drill the alert makes it look like. The report keeps those two questions separate: is it real, and how much time did it actually cost?
What actually separates a real change from noise is two things: how much the query varies on its own, run to run, and how many executions back up the average on each side. A query that takes forty milliseconds every time, and one that swings from ten to two hundred, are different animals, even at the same current average. Query Store already records that spread, in stdev_duration and stdev_cpu_time, one row per plan per interval. Nobody reads those columns by eye. There are too many queries, and turning a per-interval standard deviation into a per-half one is not simple addition.
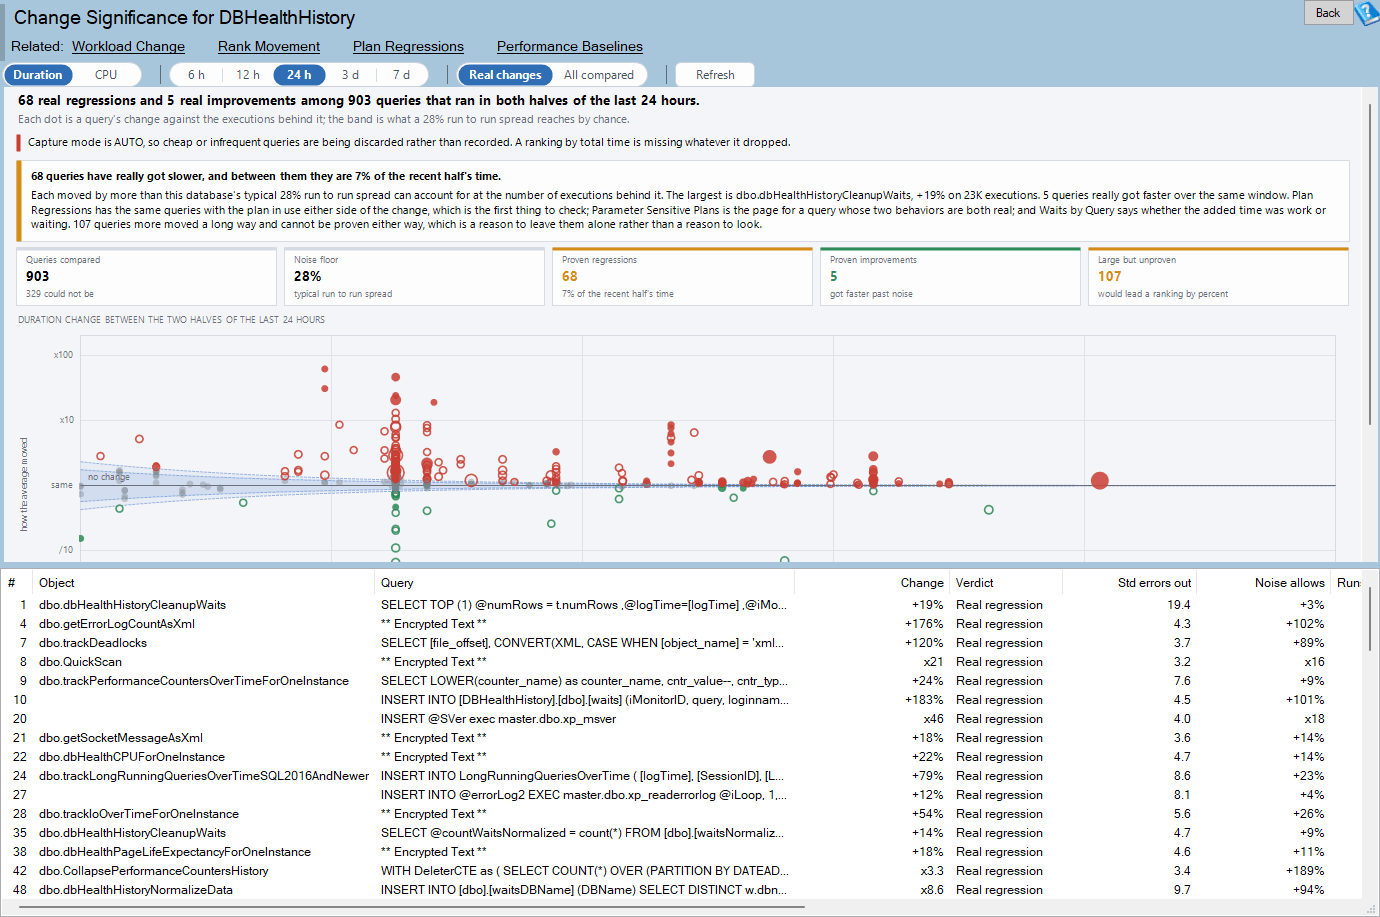
Change Significance is one of the reports in Database Health Monitor. It runs against your own servers, and it takes about a minute to have this same screen open on one of them.
What Makes a SQL Server Query Regression Statistically Significant
The test runs in a few steps. First, it combines the executions on each side harmonically. Ten thousand runs before and four after count as resting on four, not on the bigger number. Then it measures each half's spread relative to its own average. Ten milliseconds of scatter means something different on a ten-millisecond query than on a ten-second one.
Take that ninety-millisecond query from forty. If it ran ten thousand times in the first half and ten thousand in the second, the evidence is high and the band is narrow: a real move stands out fast. If it ran four times each half, the band swallows almost anything, and the same jump proves nothing.
Next it looks across every compared query to find the database's typical relative spread: the noise floor. A transactional system where everything takes four milliseconds gets a tight floor. A reporting server that never runs the same thing twice gets a loose one. Finally, it asks how many standard errors the change sits from zero, using whichever spread is larger, the query's own or the floor. Three or more, and it's called real. That's the same bar Is This Query Slower Than Normal? Ask Its Own History uses for an abnormal interval. With hundreds of queries compared on one server, anything looser would flag changes a quiet database produced by chance alone.
Duration and CPU don't share a noise floor, either. Duration includes time spent waiting, and waiting is usually noisier than CPU time alone, so the same query can look steadier on one measure than the other.
Reading the Funnel Plot
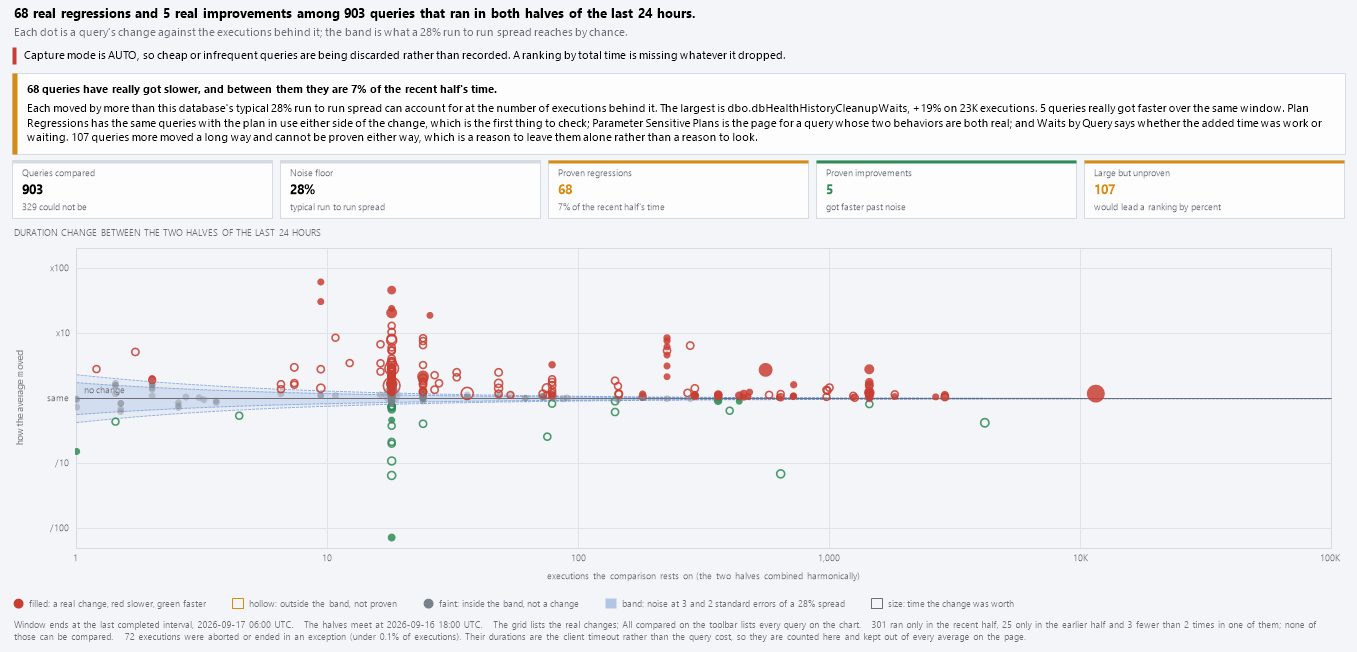
Across the chart is evidence, on a log scale. Up is the change, as a multiple, centered on no change, so twice as slow and twice as fast sit the same distance from the middle. A shaded band marks how far a query at the noise floor could drift by chance alone, at that much evidence. It narrows to the right: more executions leave less room for luck. A filled dot is a real change, red for slower and green for faster. A hollow dot sits outside the band but isn't proven; that query is just erratic. A faint dot inside the band isn't a change at all, whatever its percentage claims. The size of the dot is the time the change was worth, so a big move on a query nobody runs barely shows up.
Above the chart sits a one-line verdict for the whole database. It might say a serious share of recent time is a real regression, ten percent or more of the second half's total. It might say some queries really did get slower, and name their share. On a quiet day it says nothing measurable got slower, or that some things moved a long way without any of it being provable. And if every query only ran once per interval, it says plainly that nothing can be tested yet.
The Grid Underneath, and What's Worth Fixing
The grid lists real changes by default, sorted by the time each one added, largest first. Every column sorts, so you can flip to worst regressions, or to the queries with the widest swings. Object and Query identify the statement. Verdict says real regression, real improvement, large but unproven, or within the noise. Std errors out shows how far outside the noise a change sits; three or more is proven. Time added is what it costs: after minus before, times the runs after, so a negative number means the query got cheaper. Double-click a row and the statement appears with the test spelled out in words beside it. Right-click any row for more: explain the test in words, jump to the statement itself, or copy the whole query behind the report to run in SSMS.
| Column | What it tells you |
|---|---|
| Verdict | Real regression, real improvement, large but unproven, or within the noise |
| Std errors out | How far outside typical variation the change sits, three or more counts as proven |
| Time added | What the change is actually worth in time, positive or negative |
| Runs before / Runs after | How many regular executions back the average on each side |

Where This Fits Among the Other Reports
Change Significance is a filter, not a replacement. Plan Regressions, Workload Change and Rank Movement all rank by how much something moved. This report says which of those moves is bigger than the query's own noise, and which is just the query being itself. Right-click a proven regression to jump straight to Plan Regressions and see the plan on each side. Right-click a large, unproven change to jump to Duration Spread instead, because the finding there is variability, not a regression at all. The full column reference, including the requirements and the exact query behind the page, lives in the Change Significance documentation.
Workload Change and Rank Movement work at a different angle again: one splits a query's growth into running more often or costing more per run, the other tracks queries climbing the list over several days. Parameter Sensitive Plans matters when a query's two behaviors are both real, not noise at all. None of that replaces asking whether a given change is real first.
Requirements and Where to Find It
Change Significance needs SQL Server 2016 or newer, because Query Store, and its per-interval standard deviations, arrived with that version. Query Store has to be turned on for the database; the runtime statistics live nowhere else. Reading them needs VIEW DATABASE STATE. Find the report under a database, in the tree: Real Time, then Query Store, then Change Significance. That folder stays hidden below SQL Server 2016, and on master and tempdb, where Query Store can't be turned on at all.
The toolbar controls three things. Duration or CPU picks the measure, average duration paired with stdev_duration, or average CPU time paired with stdev_cpu_time. A window of six hours, twelve, a day, three days or a week sets how far back it looks, cut in half at the midpoint; a day is the default. Real changes or All compared decides what the grid lists, though the chart always draws every compared query regardless of that toggle.
Three details keep the numbers honest. The window always ends at the last completed interval; the one still being filled has a partial count and a partial average, so it's left out. Only regular executions are compared. An aborted execution's duration is really just how long somebody waited before giving up, and counting those would make a half look faster than it was; they're tallied separately, in the footer. Averages are weighted by executions, never averaged as if every interval counted the same. A plan that ran once and a plan that ran ten thousand times don't get equal votes.
When There's Nothing to Test Yet
Sometimes the page has almost nothing to say. That's not a bug. If nothing ran in both halves of the window, nothing can be compared; widen the window, or shorten it if Query Store was recently cleared. If every query ran exactly once per collection interval, Query Store recorded no run-to-run spread at all, and nothing can be tested until a busier stretch gives it something to measure. The chart itself only draws the four thousand most executed compared queries; the rest are named in a note below it, not dropped silently.
Back to that query at ninety milliseconds: open Change Significance, and it either has a filled red dot with three or more standard errors behind it, or it doesn't. One of those is worth an afternoon. The other is just Tuesday.
What to check on your own server
- Check that Query Store is turned on for the database you're worried about, since the runtime statistics live inside it
- Widen the comparison window when a query that clearly changed still doesn't have enough executions on both sides to test
- Compare the time added by a change, not just its percentage, before spending an afternoon on it
- Note whether a query's own run-to-run spread is wider than usual before trusting a big percentage swing
Try Database Health Monitor Today
Chasing a percentage instead of checking whether a query's change is bigger than its own noise wastes real tuning time on queries that never actually got worse. Database Health Monitor shows it on every instance you connect, in the time it takes to open the report.
Download Database Health Monitor and run the Change Significance report against your own server. There is nothing to configure first, and you will know inside a few minutes whether it tells you something you did not already know.
Related reading: Is Your SQL Server Response Time Target Being Met?. A companion report checks Query Store's own execution history against a response time target you choose, like 95% of executions within 500 milliseconds, and ranks the queries missing it most often rather than the ones simply running longest.
Related reading: Finding the Statement Inside a Loop in SQL Server. For a procedure whose total cost looks fine but whose nightly runtime keeps creeping up, a companion post walks through pulling Query Store data apart statement by statement to catch the one line running far more often than the rest of the batch.