Is Your SQL Server Response Time Target Being Met?
Support tickets say the checkout page is slow. The monitoring dashboard says the average query duration is eighty milliseconds, which is fine. Nobody ever wrote down a SQL Server response time target for that stored procedure, so there is nothing to check the average against, and the three customers who waited nine seconds this morning do not show up in it at all.
How do you know if you're meeting your SQL Server response time target? You know by measuring the actual share of executions that finish inside your SQL Server response time target, not by watching an average. Query Store's sys.query_store_runtime_stats records enough about every execution to build a cumulative curve showing exactly what percentage met a target duration like 500 milliseconds, and which specific queries are missing it most often.
Database Health Monitor's Latency Service Levels report exists for exactly that gap. Instead of one average, it plots every execution Query Store recorded as a curve, checks it against a target you pick, for example 95% of executions inside 500 milliseconds, and then names the queries breaking that promise most often.
In this post
- Choosing a SQL Server response time target
- Why the average lies
- Reading the curve
- The verdict and what the tiles mean
- The grid: who actually owns the misses
- Where to find it, and what it needs
- What the report gets right, and where it hedges
Choosing a SQL Server response time target
You set two numbers on the toolbar: a target duration, anywhere from 10 milliseconds to 5 seconds, and a goal, the share of executions that should land inside it, from 90% up to 99.9%. Pick 95% within 500 milliseconds, and the page draws every execution Query Store has recorded against that pair, then redraws the count of misses the moment you change either number. The window length, from 4 hours up to 7 days, and which slice of the curve you're looking at, all of it, the slowest 10%, or the slowest 1%, are remembered between sessions too.
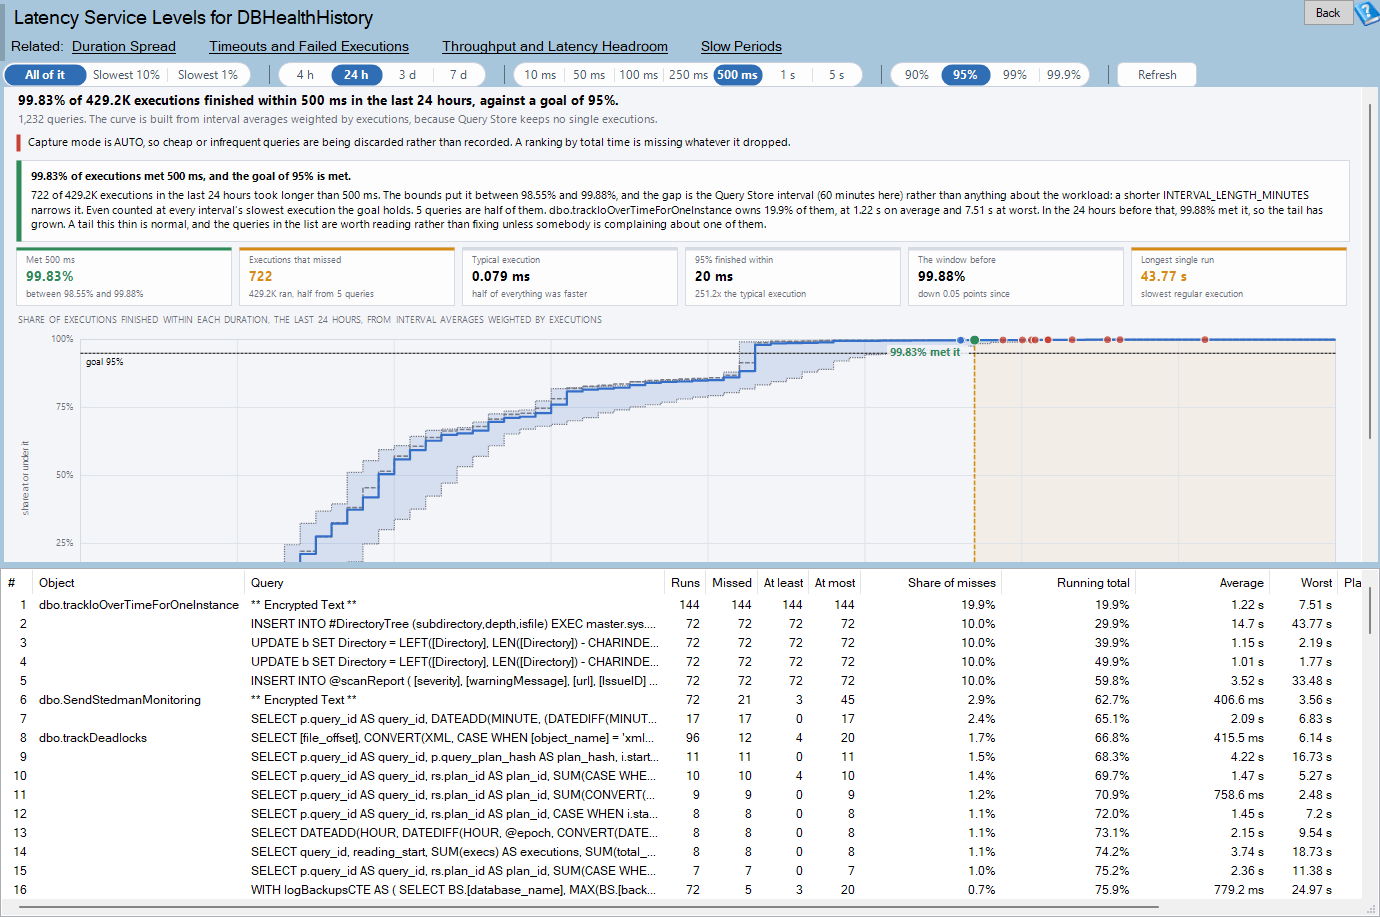
Latency Service Levels is one of the reports in Database Health Monitor. It runs against your own servers, and it takes about a minute to have this same screen open on one of them.
Why the average lies
A total or an average tells you nothing about the promise a user actually cares about. Take a checkout page that needs to feel instant: nobody asked for it to average anything, they asked for it to not be the one run in fifty that drags for nine seconds while every other one stays quick. Averaging that one slow call in with the rest is exactly what makes it disappear.
Reading the curve
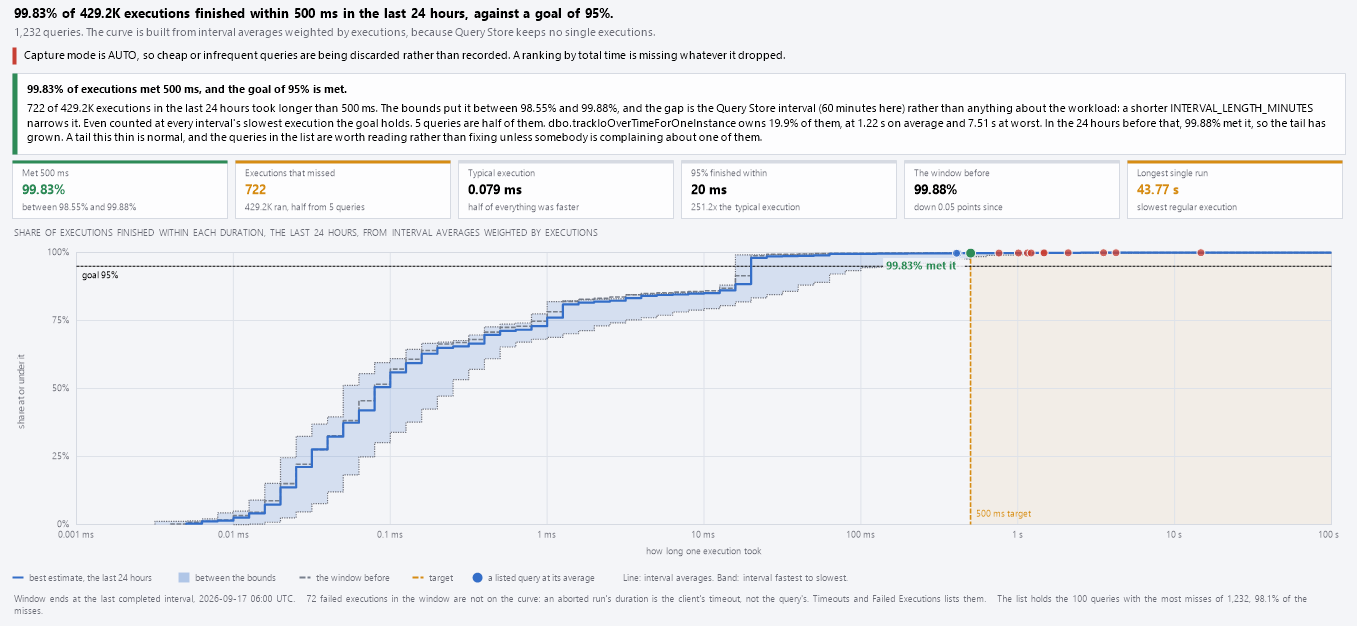
The chart is a cumulative curve. Duration runs along the bottom on a logarithmic scale, and the share of executions that finished at or under that duration climbs up the side. Move sideways from a percentage on the axis to see what duration it lines up with, or move upward from a duration to see what share of runs finished by then. The target and the goal intersect at a single point on the chart; a curve tracing above and to the left of that point kept its promise, one dipping below it broke it.
Query Store doesn't keep every execution. For each plan, in each interval, it keeps only a count and the fastest, slowest and average duration. That's not the full distribution, but it brackets it closely enough to build three curves at once:
- The solid line, the best estimate: each interval's average duration, weighted by how many executions it had
- The left edge of the band: each interval's fastest execution, the most optimistic reading possible
- The right edge of the band: each interval's slowest execution, the most pessimistic reading possible
The true curve sits somewhere inside that band. Collect in 60 minute intervals and the band stays wide; drop 'INTERVAL_LENGTH_MINUTES' down and the band narrows, though only for windows gathered after you change it.
The verdict and what the tiles mean
A verdict at the top of the chart states plainly whether the goal was met, and how sure that call is, from every execution met the target down to a specific percentage that fell short. When it falls short, the verdict also says whether a handful of queries are responsible for half the misses between them, which means fix those queries, or whether the misses are spread across the whole workload, which points at the server instead. Six tiles carry the numbers behind that verdict:
| Tile | What it tells you |
|---|---|
| Met (target) | How much of the traffic beat the target, by the best estimate, shown with its optimistic and pessimistic bounds and colored to match the goal |
| Executions that missed | The raw count of executions that missed, plus how many queries between them account for half of that count |
| Typical execution | The median duration, the point where half of everything ran faster and half ran slower |
| Goal duration | The actual duration the goal share finished within, expressed as a multiple of the typical execution |
| Window before | What share met the target across the equivalent window immediately prior, for comparison |
| Longest single run | The single slowest regular execution Query Store logged during the window |
The grid: who actually owns the misses
It ranks queries by how many executions they missed, not by how much total time they used. Whichever query burns the most total time and whichever query breaks the most promises are rarely the same one, and it's the promise-breaker people notice first. Once you've spotted a specific query here, the natural next question is whether today's numbers for it are actually unusual, and that's what Is This Query Slower Than Normal? Ask Its Own History is built to answer.
- Missed, alongside At least and At most bounds that are exact only where the two agree
- Share of misses and Running total, so you can see how few queries you'd need to fix to clear half the misses
- Average and Worst, weighted by executions rather than a plain mean
- Missed before, so a query that's new to the tail this week stands out from one that's always been there

Where to find it, and what it needs
In the tree, it's under a database: Real Time, then Query Store, then Latency Service Levels. That folder disappears entirely on anything older than SQL Server 2016, and it never shows up under 'master' or 'tempdb', since neither database can run Query Store. A few requirements have to be met before the page has anything to draw:
| Requirement | Why |
|---|---|
| SQL Server 2016 or newer | Query Store was introduced in SQL Server 2016 |
| Query Store turned on for the database | The report's entire history lives inside Query Store |
| 'VIEW DATABASE STATE' | Needed to query the Query Store catalog views for this report |
What the report gets right, and where it hedges
A few quiet details make the numbers trustworthy rather than merely plausible. The window always stops at the most recent interval Query Store finished writing, never at the current clock time, so a partially filled interval can't sneak a fraction of its count into the total. Only regular executions land on the curve; a query cut off by a client timeout is counted separately and shown on Timeouts and Failed Executions instead of quietly dragging an average down. Weight comes from executions, not from interval count: run a query once in an interval and it barely moves the curve, run it a thousand times in another and that interval carries a thousand times the pull.
The one honest gap is capture mode. Set a database's Query Store to 'AUTO' and cheap, infrequent queries get discarded before they're ever recorded, which understates the share meeting the target rather than overstating it. Durations themselves are bucketed on a logarithmic scale, roughly ten buckets to each power of ten, which compresses a week of executions into a few dozen buckets without dropping a single one, at the cost of a percentile always landing on a round step instead of an exact number.
- Duration Spread, for whether a query's slow runs are a spread that keeps widening
- Parameter Sensitive Plans, for a query that's fast on some parameters and slow on others
- Waits by Query, for what the slow ones are actually waiting on
The full reference, including every message the page can show and the exact queries it runs, is in the Latency Service Levels documentation.
What to check on your own server
- Query 'sys.database_query_store_options' to confirm Query Store is turned on for the database you care about
- Confirm you hold 'VIEW DATABASE STATE' on that database so you can read its Query Store catalog views
- Check the 'INTERVAL_LENGTH_MINUTES' value there too, since a long collection interval widens any latency estimate built from it
- Look up 'query_capture_mode', and note if it's set to 'AUTO', since that discards cheap and infrequent queries before they're recorded
- Decide on an actual target and goal, such as 95% of executions within 500 milliseconds, based on what users were promised
Try Database Health Monitor Today
It replaces a comforting average with a real answer to whether your database is meeting the response time it promised users, and names exactly which queries are breaking that promise most often. Database Health Monitor shows it on every instance you connect, in the time it takes to open the report.
Download Database Health Monitor and run the Latency Service Levels report against your own server. There is nothing to configure first, and you will know inside a few minutes whether it tells you something you did not already know.
Related reading: Finding the Statement Inside a Loop in SQL Server. For a procedure whose total cost looks fine but whose nightly runtime keeps creeping up, a companion post walks through pulling Query Store data apart statement by statement to catch the one line running far more often than the rest of the batch.
Related reading: msdb Is Too Big? Here's What's Actually Filling It. If backup history and job history are quietly filling msdb on that same server, this report breaks the growth down table by table and shows how many days of history each source is actually holding.