Database Health Monitor 4.1743: Query Tuning Workbench, Backup SLA Policies and 920 Fixes

Database Health Monitor 4.1743 is here, and it is built around one idea: you should be able to try a change safely, prove that it helped, and prove that your backups meet a standard, without leaving the application. This release adds a Query Tuning Workbench, Backup SLA policies with a compliance report and a new alert, a Default Trace Events report, a safer set of Quick Scan one-click fixes, a round of navigation improvements, and 920 fixed tickets, including 16 crashes and 131 fixes in Azure SQL Health Monitor.
This post walks through everything in the release. If you only have a minute, the short version is in the first section. If you want the detail on a feature, each one has its own section, and you can jump straight to it.
The short version
Version 4.1743 contains 2 new reports, 13 new features and 920 bug fixes. The headline items are:
- The Query Tuning Workbench, on the Tools menu, which runs a query with the actual execution plan and STATISTICS IO and TIME, and keeps every run as a numbered variation so you can compare them side by side.
- Backup SLA policies, with a new Backup SLA report, a new Backup SLA Violation alert (5035) that sends an all clear, and policy information that also shows up in Backup Status and Recovery Exposure.
- A Default Trace Events report that groups what the default trace has been recording on each instance.
- Safer Quick Scan one-click fixes, which now show you the exact T-SQL, capture the values being replaced, offer an undo script and write a fix log.
- Technical Debt snapshots, so you can see whether your technical debt is growing or shrinking.
- Estate health on the Performance Dashboard, with the reasons behind each server’s status shown as chips.
- A set of navigation improvements: forward navigation, a Stop button for slow reports, Copy Link to This Report, a richer server tree menu, Recent Messages, column filters that survive a refresh, and F1 help that works offline.
- A /selftest mode for Decryptionator.
The theme of the release is trying a query change safely, holding databases to a backup standard, making one-click fixes reversible, and making the application easier to move around in. Those four themes shaped the order of this post.
Trying a query change safely: the Query Tuning Workbench
Anyone who has tuned queries for a living knows the loop. You change something, run the query, look at the time, look at the reads, look at the plan, and then try to remember whether the version you ran ten minutes ago was better or worse. By the fifth variation you are comparing against your memory, a scrawled note, or three query windows that all look alike.
The Query Tuning Workbench replaces that loop with something that remembers for you. You find it on the Tools menu.
What a run captures
The workbench runs your query with the actual execution plan and with STATISTICS IO and TIME turned on, and it keeps each run as a numbered variation. Every variation records:
- elapsed time and CPU time
- reads, broken out by kind and by table
- rows returned
- memory grant
- degree of parallelism
- spills
- warnings
- a plan shape word, a short label that describes the overall shape of the plan
Variations sit side by side. The best value in each row is shown in bold, and any regression of more than 20 percent against the best is shown in amber. That means you do not have to read every number. You glance across the row, and the amber cells tell you what got worse.
A run happens inside a transaction that rolls back
The most important design decision in the workbench is what happens to your data when you run a query. A run happens inside a transaction that is rolled back by default. If you are tuning an UPDATE, a DELETE or something that calls a procedure with side effects, you can iterate on it as many times as you like without leaving changes behind.
The workbench also checks the query before it runs it. When it finds that the query changes data or schema, it asks first. You are never surprised by a statement that you did not realize was a write.
Starting from the plan cache, Query Store or history
You do not have to paste a query to get started. Queries can be picked from the plan cache, from Query Store, or from history. When you start from a cached query, the workbench builds a baseline variation, V1, from the cached plan without executing it. That gives you a starting point to compare against even for a query that you would not want to run in production just to find out how it behaves.
You can also reach the workbench from where you find slow queries in the first place. Open it from the Tools menu, from the Query Advisor, or use Tune this query on What Is Active and on Plan Cache.
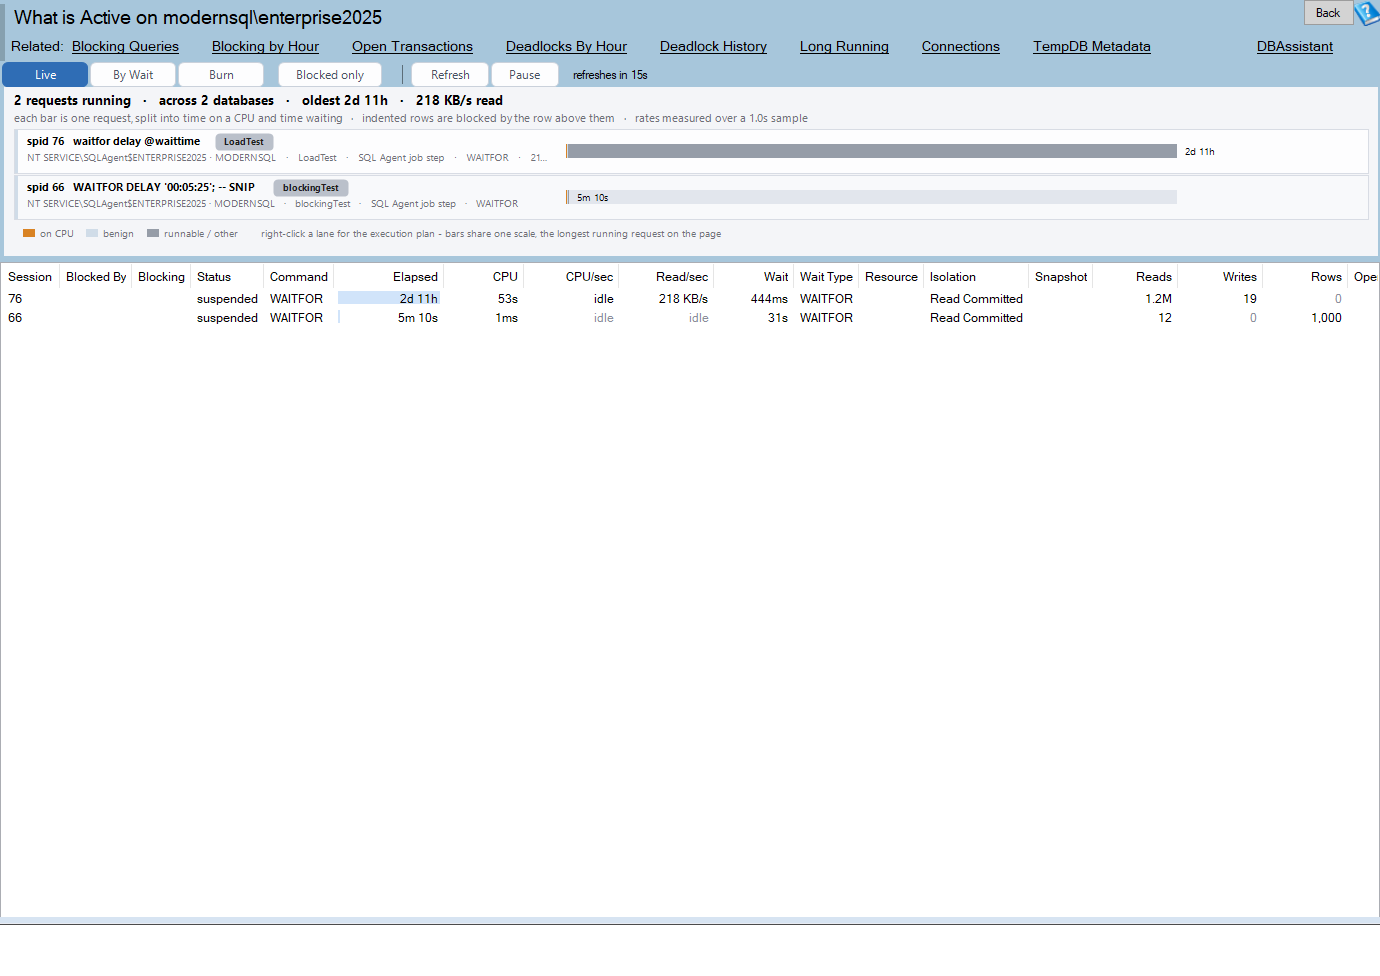
What Is Active shows what is running right now. When something there is slow, Tune this query takes you from the symptom to the workbench in one click.
Comparing variations
Compare puts two variations next to each other and shows:
- metric deltas for every captured measurement
- per table reads, so you can see which table’s I/O changed
- warnings added or removed
- operator changes in the plan
The per table read comparison is the one that earns its place most often. A change in total logical reads tells you that something improved. A change in reads for one table tells you why.
Trying an index without building one for real
The missing index strip is where the workbench goes beyond comparing queries. It can try an index in two ways.
- For real, inside the rollback. The index is created inside the transaction, the query runs against it, and the whole thing is rolled back. This is disabled for instances flagged Production, and even where it is allowed it requires a typed confirmation.
- As a hypothetical index. No index is built. This is the lower impact option and is useful when you only want to see whether the optimizer would use an index.
Either way, the question you started with, would this index help this query, is answered with a variation you can compare against everything else you tried.
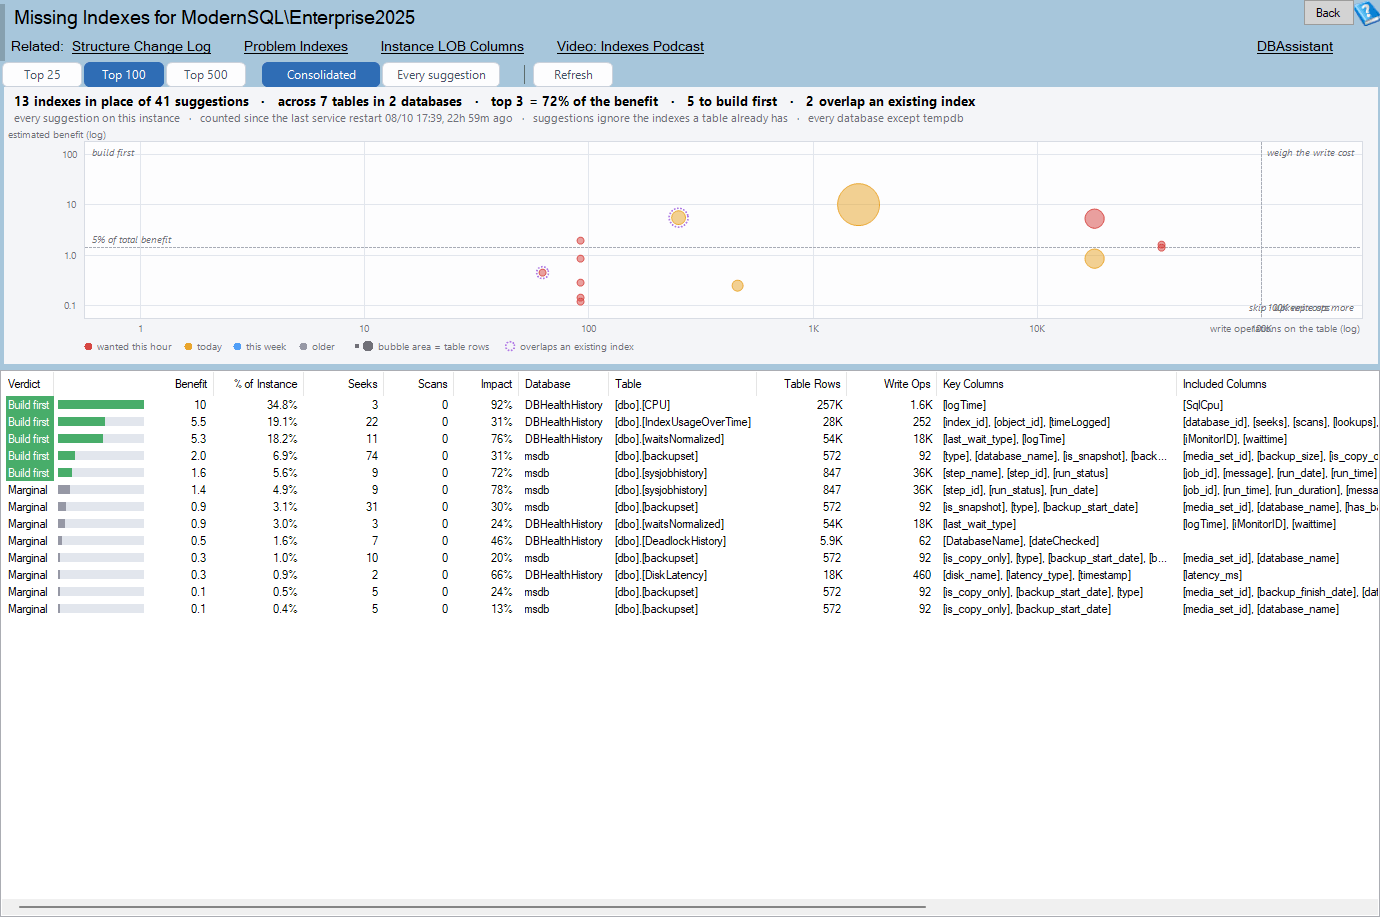
The Missing Indexes report is the usual place that an index idea starts. The workbench is where you find out whether the idea is any good before you create anything.
Saving and sharing a session
A tuning session saves as a .dbhtune file. The file contains no connection details, so it is safe to attach to a ticket or send to a colleague. A session can also be saved as a standalone HTML report, which is the format to use when the person reading it does not have Database Health Monitor.
Holding databases to a backup standard: Backup SLA
Most monitoring tells you when a backup is late. A late backup is a fact. Whether it matters depends on what you promised. A database that is allowed to lose a day of data and a database that is allowed to lose five minutes of data are very different things, and a single global threshold for both of them is wrong for at least one.
Backup SLA policies let you say what you promised, per database, and then measure against it.
Defining the terms
You define recovery point and recovery time terms for each database. To save you from starting with a blank page, there are Tier 1 to Tier 3 presets, and you can add offsite terms. Assignment is flexible: assign a policy to a database directly, or assign it by pattern so that a naming convention does the work.
How violations are evaluated
The history database evaluates every database every 15 minutes. When it finds a violation, it back dates when the violation started, so the time at risk reflects when your terms were first missed rather than when the evaluation noticed.
The evaluation drives a new alert: Backup SLA Violation (5035). The alert has an all clear, so you hear when the problem starts and you hear when it ends. Alert 5002 is unchanged, and it now points to the new alert.
The Backup SLA report
The new Backup SLA report, in Instance reports, shows every database against the backup terms it is assigned. For each database you see:
- the policy
- the full, differential and log targets
- the current status
- the time the database has spent at risk
Violations are tracked as intervals. That distinction matters. A database that missed its terms overnight and then recovered after a morning backup shows how long it was exposed, not just that it is late right now, or worse, that it looks fine this morning.
A few details are worth knowing:
- Databases on unreachable instances are shown as Unknown instead of compliant. A database you cannot see is not a database you can vouch for.
- Databases in SIMPLE recovery are flagged when a log term is set, because a log backup target on a database that cannot take log backups is a contradiction in the policy.
- The report exports to HTML, CSV and Word.
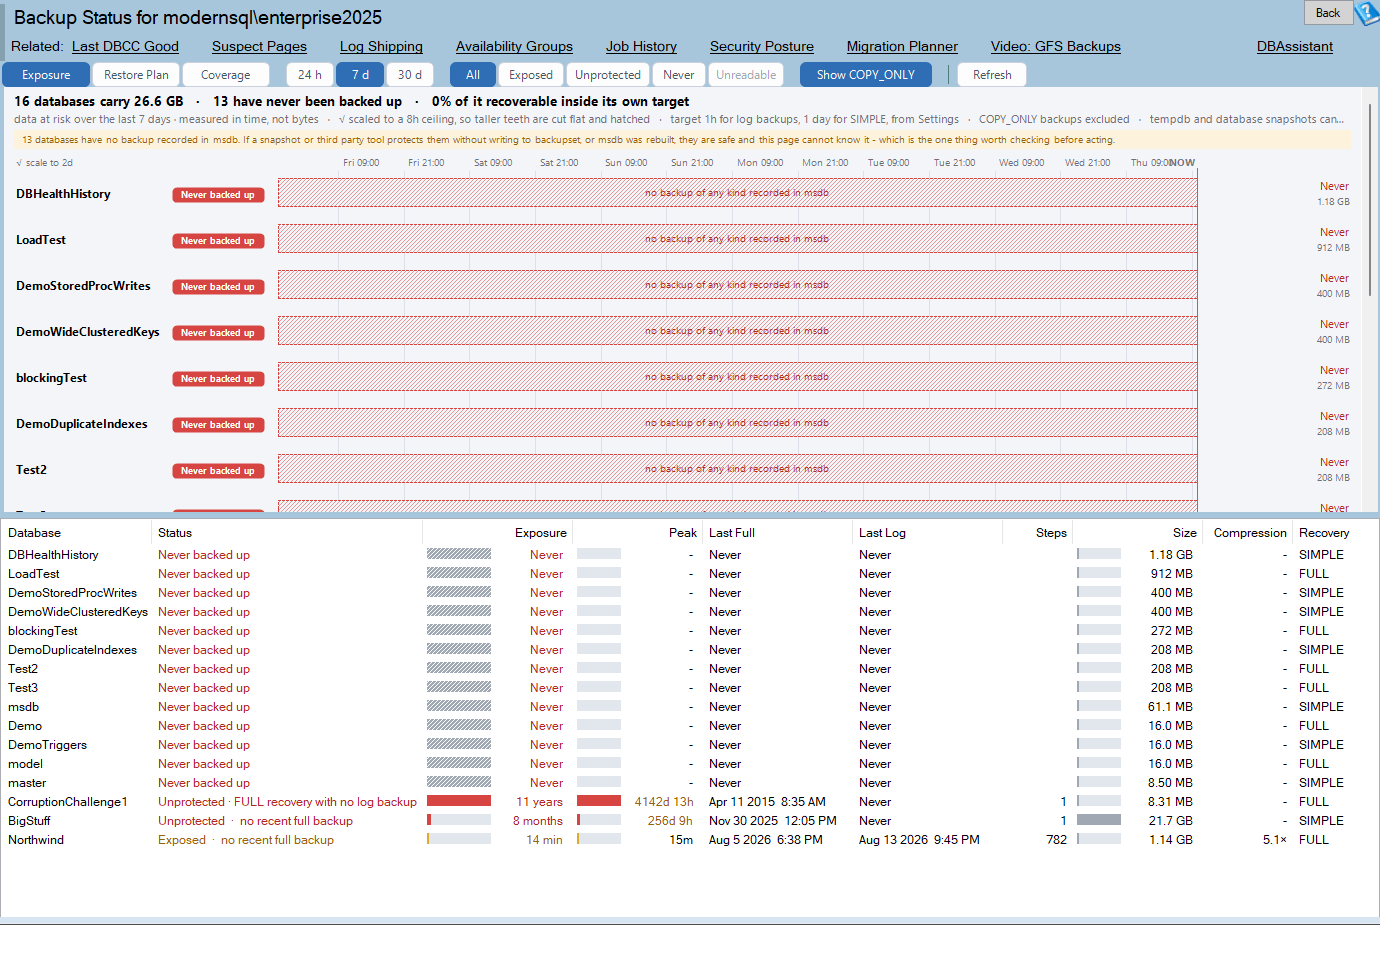
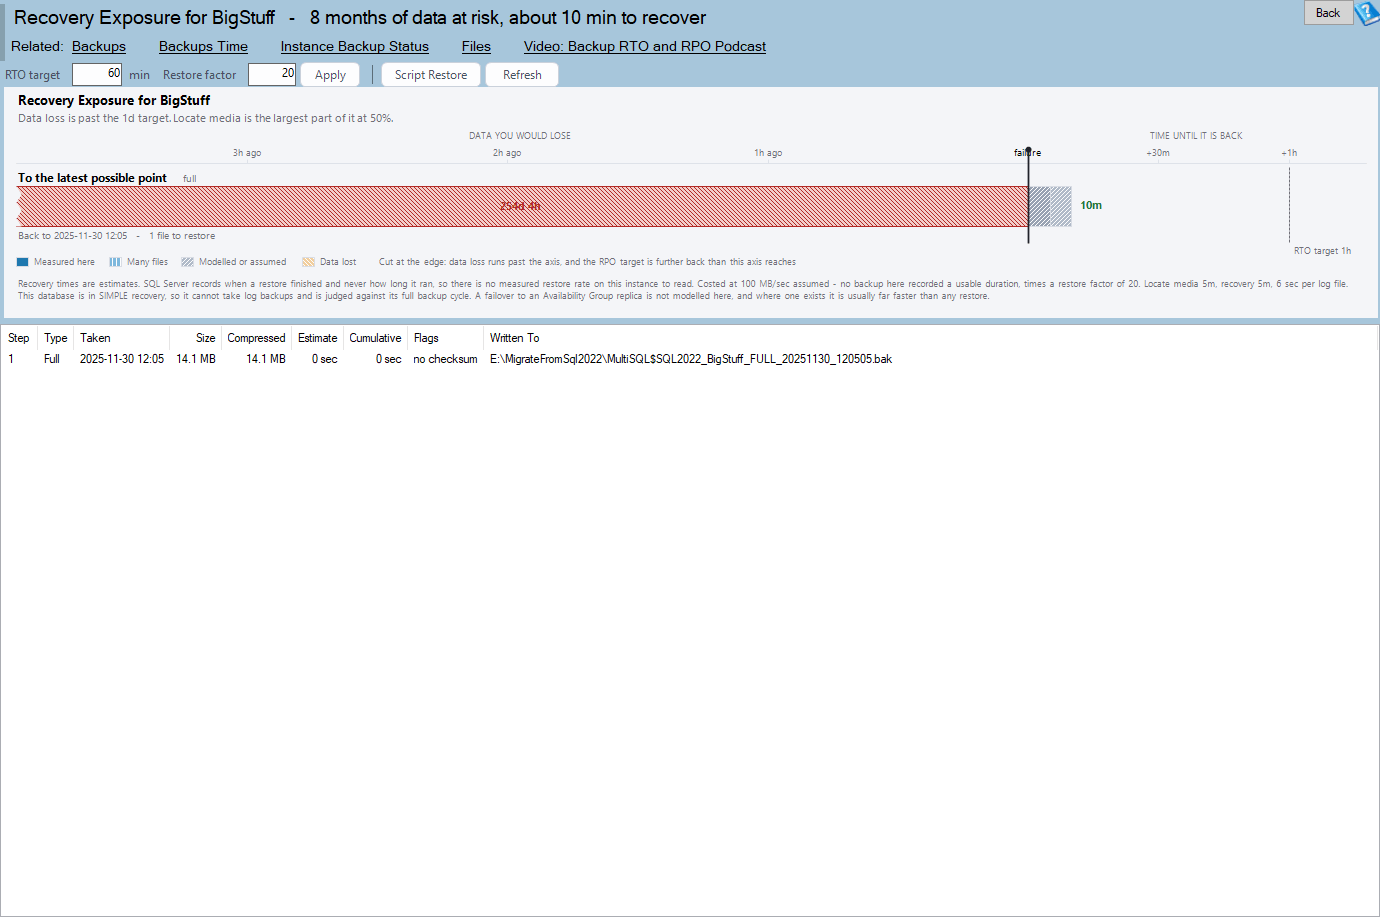
The policy and its targets also appear in Backup Status and in Recovery Exposure, so you do not have to open a separate report to see the standard that a database is measured against.
What the default trace has been recording: Default Trace Events
The default trace is one of the oldest diagnostic features in SQL Server, and it is easy to forget that it is there. It records a small set of events without any setup, and it often holds the answer to questions such as who dropped that table, when did the log file last grow, and why did that query spill.
The new Default Trace Events report, in Instance reports, reads the default trace and groups what it recorded across all databases:
- data and log file autogrowths and shrinks
- DBCC runs
- objects created, altered and deleted
- sort and hash warnings
The trace path is found the same way for every report that reads it, including on SQL Server on Linux, so you get the same result whichever platform the instance runs on.
The grouping is the point. A raw read of the trace is a long list. Grouped by category and database, it answers a different question: where is the activity concentrated? A single database with hundreds of log autogrowths is a story. A handful of objects altered by an unexpected login is a different story.
Making one-click fixes reversible: safer Quick Scan
Quick Scan finds problems, and for many of them it offers a one-click fix. A one-click fix is convenient, and convenient changes are exactly the ones that deserve a safety net.
Every Quick Scan one-click fix now goes through a confirmation. The changes are:
- The confirmation shows the exact T-SQL. You see what will run before it runs.
- Open script instead. If you would rather review the script, or run it yourself in a change window, you can open it as a script instead of running it.
- An undo script. The values being replaced are captured before the change, so an undo script is offered.
- A fix log. Every change is written to a fix log, so there is a record of what was changed, when, and what it replaced.
- Extra warnings for dangerous changes. Changes such as the recovery switch and DROP USER get an additional warning.
- Other instances. When you run a fix on other instances, each instance is captured and logged on its own.
The combination is what matters. Showing the T-SQL addresses the question of what is about to happen. Capturing the old values and offering an undo script addresses what happens if it was the wrong call. The fix log addresses the question that always arrives a week later: who changed this?
Is the debt growing? Technical Debt snapshots
The Technical Debt report finds the things in your databases that cost you over time. A one time list of those is useful. A trend is more useful, because the first question after a cleanup is whether it made any difference.
Technical Debt now keeps snapshots:
- Each completed scan is kept.
- The last scan is shown when the page opens, so you do not wait for a new scan to see where things stand.
- It is compared with the one before.
- A since last scan line, a sparkline, a Change column and New, Worse, Better and Fixed filters show whether the debt is growing or shrinking.
The filters turn a long list into a short question. Filter to New to see what appeared since last time. Filter to Fixed to see what your recent work accomplished, which is a satisfying list to show a manager.
Estate health on the Performance Dashboard
The Performance Dashboard is the page that you look at across a whole estate of servers, so its job is to tell you where to look first.
In this release:
- Each server card shows the reasons behind its status as chips. Instead of only a color, you see why: what rule fired.
- A server that does not answer, or is not licensed, is shown as its own state instead of being lumped in with a healthy or an unhealthy one.
- Low memory and plan cache rules were added.
- Servers are sorted worst first within each environment group, so the one that needs you is at the top of its group.
Moving around the application
Several smaller changes in 4.1743 are about how the application feels during a long working day. None of them is a headline on its own, and together they remove a lot of small friction.
Forward navigation
There is now a Forward button, and Alt+Left and Alt+Right work as back and forward. The mouse back and forward buttons work too. If you went back one report too many, you can go forward again.
Stop a slow report
A Stop button appears on the loading panel after 3 seconds, and Esc does the same. A Stopped card then offers Try again and Go back. A report against a busy production server can be slow, and you should not have to wait it out to regain control.
Copy Link to This Report
Copy Link to This Report copies a link to the current report. The link carries the server name only, so it does not carry credentials. A /openreport command line switch opens it, and a pasted link also opens from the command palette. It is a quick way to hand a colleague the exact report you are looking at.
Server tree menu
The server tree menu now has Open in SSMS, Copy server name and Copy connection details for SQL Server and Azure nodes. Ctrl+C on a selected server copies it.
Recent Messages
The last 50 notifications are kept, so a toast that faded before you finished reading it can be read again. You can find them from Help, from the command palette, or with Ctrl+Shift+M.
Column filters survive a refresh
A live report that reloads its grid now reapplies the column filters instead of silently dropping them. If you filtered a live grid down to the one database you care about, the refresh no longer undoes your work.
F1 opens the installed help
Help links in dialogs and advisors now open the help file installed with the product instead of the web, so they work offline. Settings opens at the topic for the active tab.
920 fixes
The release closes 920 tickets. That includes 16 crashes and 131 fixes in Azure SQL Health Monitor.
Most of the remaining fixes are wrong or misleading results in reports and Quick Scan checks, in a few specific situations that tend to expose assumptions:
- case sensitive collations
- Unicode names
- large files
- Azure SQL Managed Instance
There are also several history database upgrade steps, through version 1742, that deliver fixed procedures to databases that were already upgraded. If you use the history database, those steps are applied when the history database is upgraded.
A report that gives a wrong answer is worse than a report that fails, because a failure gets noticed. The large share of this release spent on correctness is deliberate.
A worked example: tuning a slow query with the workbench
The following scenario is illustrative, and the numbers are made up to show the flow rather than taken from a real server. It shows how the pieces of the workbench fit together on a typical afternoon.
Suppose What Is Active shows a query that has been running for much longer than it should. It reads from an orders table, joins to customers, and filters on a date range. You click Tune this query, and the workbench opens with the text of the query loaded.
Step one is the baseline. If you came from the plan cache, the workbench builds variation V1 from the cached plan without running anything. You now have a record of the reads, the memory grant and the plan shape word for what production has been using. If you came from What Is Active and the query is a safe SELECT, you can also run it to capture a real V1, which records elapsed time, CPU, reads by table, rows, memory grant, degree of parallelism, spills and warnings.
Step two is a hypothesis. The plan shows a scan on the orders table and a warning. The missing index strip suggests an index on the date column. You do not know whether it will help, and you are not going to create it on a production server on a hunch. On an instance that is not flagged Production, you try the index for real inside the rollback. The workbench creates the index inside the transaction, runs the query, records variation V2, and rolls the transaction back. The index never exists outside that run. On an instance that is flagged Production, the for real option is disabled, and you use a hypothetical index instead.
Step three is the comparison. V2 sits next to V1. The row for elapsed time is in bold for V2. The per table reads show that reads on the orders table dropped, and that reads on the customers table did not change. The warning that was on V1 is gone. The operator changes show a scan replaced by a seek. That is more than a faster number. It is an explanation for why it is faster.
Step four is a second hypothesis. Maybe a rewrite helps more than the index. You edit the query text and run again. This is V3. Perhaps V3 is faster in elapsed time but uses a larger memory grant, and the workbench shows that column in amber because it regressed by more than 20 percent against the best. You have learned something that a stopwatch would never have told you: the rewrite trades memory for speed.
Step five is the record. You save the session as a .dbhtune file and attach it to the ticket. The file has no connection details. Or you save the HTML report and send it to the developer who owns the query, who can read it without installing anything.
None of those steps needed a second query window, a spreadsheet of timings or a trip to a development server. That is the point of the workbench.
Why these features belong in one release
A release with a Query Tuning Workbench, a backup compliance dashboard and a one-click fix log can look like a grab bag. There is a common thread, and it is worth stating plainly, because it explains the decisions made inside each feature.
Every one of these features is about a decision you have to make with incomplete information. Should I create this index? Is this database meeting its backup promise? Is it safe to run this fix? Which of my forty servers should I look at first? In each case the old answer was to guess, or to do the work by hand. In each case the new answer is to show you the evidence.
Every one of them also makes the safe path the easy path. The workbench rolls back by default. The fix confirmation shows the T-SQL by default. The SLA report shows Unknown instead of compliant when it cannot see a server. The estate health chips show a reason instead of a bare color. When a tool has to choose between a default that is convenient and a default that is safe, the choice in this release was the safe one.
And every one of them leaves a record. A tuning session is a file. A fix is a line in a fix log. A violation is an interval with a start and an end. A technical debt scan is a snapshot you can compare. Records are what turn a one time check into something you can learn from, and something you can show other people.
Backup SLA in practice
A policy is only useful if the terms in it are honest, so here is a way to approach the first week.
Start with tiers, not exceptions. The Tier 1 to Tier 3 presets exist so that you can sort your databases into three buckets before you worry about individual numbers. Tier 1 is for the databases that the business cannot lose data from for more than a few minutes. Tier 3 is for the ones where a nightly backup is fine. Most estates are mostly Tier 3 with a short list at the top.
Assign by pattern where you can. If your databases follow a naming convention, a pattern assignment means that a new database is covered the day it is created, with no one having to remember to add it to a list. A database that is not covered by any policy is a database whose backups nobody has promised anything about, and that is worth knowing too.
Read the first report as a discovery exercise. The first time the Backup SLA report runs against a real estate, expect it to find violations. Some will be real, and some will be that the terms you assigned were more aggressive than what you have been doing. Both are useful. A real violation is a backup gap. A terms mismatch is a conversation about whether the standard or the schedule is wrong, and you now have the evidence to have it.
Watch the at risk time, not only the status. Because violations are tracked as intervals, the time at risk is a number you can report. A database that spent four hours at risk last month is a different conversation from one that spent four days.
Do not ignore Unknown. An Unknown database is one on an instance the monitor could not reach. It is not a violation and it is not compliance. It is a prompt to find out why you cannot see the server.
Check the SIMPLE recovery flags. If a log term is set on a database in SIMPLE recovery, the report flags it. The fix is either to change the recovery model, if the database really does need point in time recovery, or to remove the log term from the policy, if it does not.
Use the other reports for context. Backup Status and Recovery Exposure now show the policy and its targets, so when you are looking at a database’s backup history you can see the promise next to the reality.
Navigation in practice
The navigation changes are small individually, so here is how they combine in a typical troubleshooting session.
You are looking at the Performance Dashboard, and the worst first sorting puts a production server at the top of its group. Its card shows chips for the reasons, and one of them is low memory. You open the server and drill into a report. The report is slow because the server is under pressure. After 3 seconds the Stop button appears. You press Esc, get the Stopped card, and choose Go back instead of waiting.
You try a lighter report instead, and it shows something worth sharing. You use Copy Link to This Report, paste the link into a message to a colleague, and they open it from the command palette on their own machine. The link carries the server name and nothing else.
You want to check something in SSMS, so you right click the server in the tree and choose Open in SSMS. Later you realize that the toast about a finished export faded before you read the file name, so you press Ctrl+Shift+M and read it in Recent Messages. You filtered a live report to one database, and it refreshed, and the filter stayed. You press F1 on a dialog, and the installed help opens at once, with no internet required.
Each of those is a few seconds saved or a small annoyance removed. Over a week of work they add up.
Questions and answers
Will the Query Tuning Workbench change my data?
By default, no. A run happens inside a transaction that is rolled back. When the workbench finds that the query changes data or schema, it asks before it runs. If you want to see what a statement would do, you can use the workbench, and then decide separately whether to run it for real in your own session.
Can I try an index on a production server?
Trying an index for real inside the rollback is disabled for instances flagged Production, and even where it is allowed a typed confirmation is required. The hypothetical index option is available when you want to see whether the optimizer would use an index without building one.
What is in a .dbhtune file?
A tuning session: the variations and their measurements. It does not contain connection details. That is deliberate, so that you can share a file without sharing a server name or a login.
How often are Backup SLA policies evaluated?
The history database evaluates every database every 15 minutes. When it finds a violation, it back dates when the violation started.
What happens if an instance is unreachable?
Databases on unreachable instances are shown as Unknown instead of compliant. The report will not tell you that a database is meeting its terms if it could not look.
What does the Backup SLA Violation alert do when the problem goes away?
It has an all clear. The alert is number 5035. Alert 5002 is unchanged and now points to the new alert.
Does the undo script cover every Quick Scan fix?
The values being replaced are captured before the change, so an undo script is offered. Dangerous changes, such as the recovery switch and DROP USER, get an extra warning on top of the confirmation. Read the confirmation for each fix, because it shows the exact T-SQL that will run.
Does the Default Trace Events report work on Linux?
Yes. The trace path is found the same way for every report that reads the default trace, including SQL Server on Linux.
Do the help links still need an internet connection?
No. Help links in dialogs and advisors now open the help file installed with the product instead of the web, so they work offline.
Upgrading
Install 4.1743 over your existing installation as you would any other update. A few notes are worth keeping in mind.
- If you use the history database, it will be upgraded through version 1742. Several of those upgrade steps deliver fixed procedures to databases that were already upgraded, which is how fixes reach history databases that exist today.
- Backup SLA policies are new. Nothing is evaluated until you define and assign a policy, so a default install does not suddenly start raising the new alert.
- The Quick Scan one-click fixes now always confirm. If you have habits built around fixes that ran immediately, expect one extra click, and expect that click to show you the T-SQL.
- Decryptionator’s /selftest is a new switch and does not change how the tool behaves without it.
Where to begin
If you are upgrading, a sensible order is:
- Open the Query Tuning Workbench from the Tools menu, and pick a query from the plan cache. See what the baseline variation shows.
- Open Backup SLA policies, apply a tier preset to a group of databases, and look at the Backup SLA report after the next evaluation.
- Run Quick Scan and try a one-click fix on a development instance, to see the confirmation, the undo script and the fix log.
- Run Technical Debt twice, and look at the Change column on the second run.
- Open Default Trace Events on an instance you know well, and see whether the autogrowth counts surprise you.
Download
Database Health Monitor 4.1743 and Azure SQL Health Monitor are available now. Get the latest version at the download page.
Thank you for using Database Health Monitor. If you find something that does not behave the way this post says it should, tell us, because that is how the next 920 fixes get found.