SQL Server Disabled Index: Why Your Query Ignores It
A query that took milliseconds last quarter now scans the whole table, and nobody touched the code. You open the plan and the index you expected is nowhere in it. You look in Object Explorer and there it is, name and all. It is a SQL Server disabled index, and it has been quietly useless for months.
How do I find a SQL Server disabled index and the other problem indexes on my instance? A SQL Server disabled index stays in the catalog, but queries cannot use it and writes stop maintaining it. Because sys.indexes is database scoped, you must check every database, including master, model and msdb. Rebuild the index to bring it back, or drop it if nothing needs it. Check fill factor and hypothetical indexes in the same pass.
Finding these by hand means visiting every database, because sys.indexes has no server-wide view. Database Health Monitor does that walk in its Problem Indexes report, and it catches two other kinds of broken index on the way past.
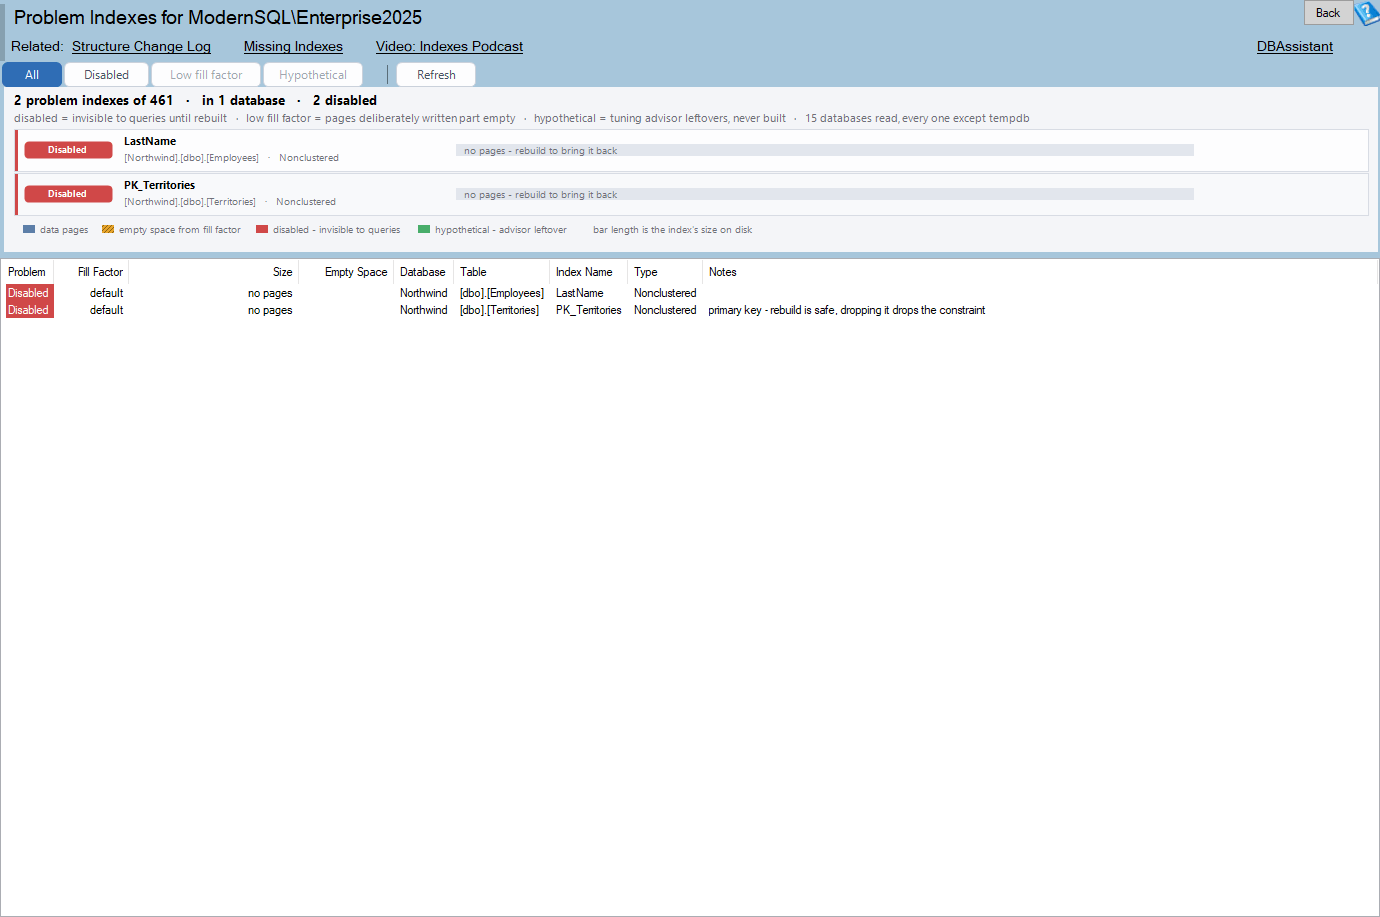
Problem Indexes is one of the reports in Database Health Monitor. It runs against your own servers, and it takes about a minute to have this same screen open on one of them.
Three ways an index exists and still fails
They look alike in a catalog listing. They need different fixes.
| Class | What is wrong | The fix |
|---|---|---|
| Disabled | Queries cannot use it and writes are not maintaining it. | Rebuild it to bring it back, or drop it. |
| Low fill factor | Every page is deliberately written part empty. | Rebuild at fill factor 99 to reclaim the space. |
| Hypothetical | A Database Engine Tuning Advisor leftover. Metadata only, never built. | Drop it. |
The hypothetical class is the easy win. There are no pages behind it, so dropping one frees nothing and risks nothing. Someone ran the tuning advisor, applied part of its advice, and walked away. The metadata stayed.
Disabled indexes are sneakier. Often one was switched off for a bulk load that finished months ago and nobody switched it back on. You still pay for it in storage. You pay again in confusion, because everyone assumes it is helping.
Why a SQL Server disabled index goes unnoticed
The usual first move is to scan a status column and look for anything that is not Enabled. That works for exactly one of the three classes.
A low fill factor index is enabled. It is just built mostly out of air. The old version of this report showed Enabled against most of its rows, which is technically true and tells you nothing. The same old page never looked for hypothetical indexes at instance level at all, so those only showed up if you drilled into one database. It also skipped master, model and msdb, which meant a disabled index on msdb.dbo.sysjobhistory was invisible.
Then there is the number itself. Fill factor 0 looks like the worst possible setting. It is not. Zero means the server default, and it is not reported. The threshold that counts as a problem is a fill factor below 70. Misreading that zero is the most common mistake with this setting, and a quick query that filters on a small number will bury you in false alarms.
Measure the empty space, not the percentage
Fill factor 60 on a tiny index is trivia. Fill factor 60 on a large one is gigabytes. A percentage cannot tell those apart.
So the chart draws each index as a bar split two ways: the data it holds, and the space its fill factor forces empty. For a low fill factor index, that empty portion is what a rebuild gives back. You see the size of the problem instead of inferring it.

The order is deliberate. Disabled indexes lead, then low fill factors ranked by how much a rebuild would reclaim, and hypothetical indexes close the list. Verdict chips name each class, so you are not relying on color alone. The summary line above the chart gives the totals, for example 34 problem indexes in 6 databases, with 28 low fill factor indexes reclaiming 4.1 GB.
Check the subtitle too. It tells you how many databases were actually read. Each database is visited in its own TRY, so one unreadable database does not sink the report, but it does mean a partial answer. The subtitle makes that visible.
Reading the grid

- Problem names the class:
Disabled,Low fill factororHypothetical. - Empty Space is what a rebuild would reclaim, and is blank where that does not apply.
- Notes sits ahead of Type because it explains the problem, including whether the index is unique or backs a constraint.
- Database, Table and Index Name locate it. Hover over a row to see every column in full.
The toolbar filters (All, Disabled, Low fill factor, Hypothetical) narrow the chart and grid without re-querying. A filter with nothing behind it disables itself, so you learn which classes you have before you click.
What to do with the answer
Work in this order. Hypothetical rows first, since they are free. Then disabled indexes. Then low fill factor, largest reclaimable space first, which is how the chart already sorts them.
The right-click menu matches the problem. A hypothetical index only gets a drop, because there is nothing real to rebuild. Rebuild confirms first, names the index, table and fill factor, and warns that the rebuild holds locks on the table while it runs. With many rows, use Copy Rebuild scripts for all N shown, which groups the statements by database with a USE for each, and run them in a maintenance window.
One rule is firm. A unique or constraint-backed index cannot be dropped from the page, because dropping it drops a constraint. You get a script instead, with comments spelling out what it really removes. Read the Notes column before you drop anything.
Not every pattern is a mistake. A cluster of indexes at fill factor 50 or 60 usually means a maintenance job applied one value everywhere, and that is rarely right, because fill factor should follow each index's insert pattern. But a low fill factor can be deliberate on an index with heavy mid-page inserts. The report flags it so you can confirm it was a decision.
Zero rows is the good outcome. If you want to pair this with the additions side of index work, read SQL Server Missing Indexes: Read Write Cost First. For the full column reference, see the Problem Indexes documentation.
What to check on your own server
- Check how many databases the report actually read before you trust an empty result
- Drop the hypothetical indexes left behind by the Database Engine Tuning Advisor
- Rebuild or drop each disabled index, after reading its Notes column
- Rebuild low fill factor indexes at fill factor 99 in a maintenance window, largest empty space first
Try Database Health Monitor Today
Problem Indexes finds the disabled, half-empty and never-built indexes that sit in your databases costing space and confusion while no query benefits from them. Database Health Monitor shows it on every instance you connect, in the time it takes to open the report.
Download Database Health Monitor and run the Problem Indexes report against your own server. There is nothing to configure first, and you will know inside a few minutes whether it tells you something you did not already know.