Wait Based Tuning: Which Part of the Bar to Read First
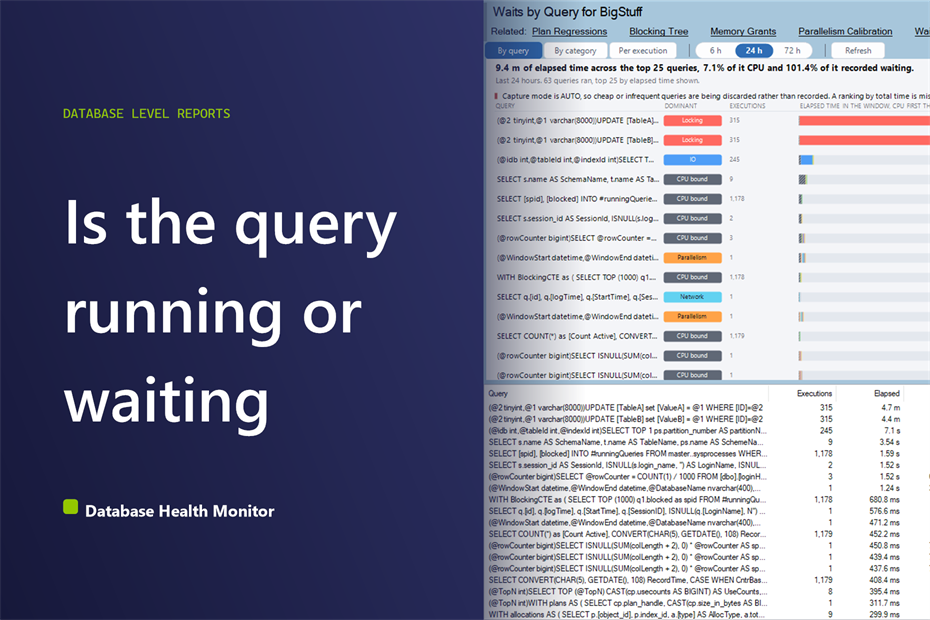
You have a query that takes forty seconds and you need to know why. Is it running that whole time, or is it standing in a queue? That one question decides whether you spend the afternoon on indexes or on blockers, and wait based tuning is the habit of asking it first. Database Health Monitor has a report built for exactly this: Waits by Query, which puts every query's elapsed time into a single bar.
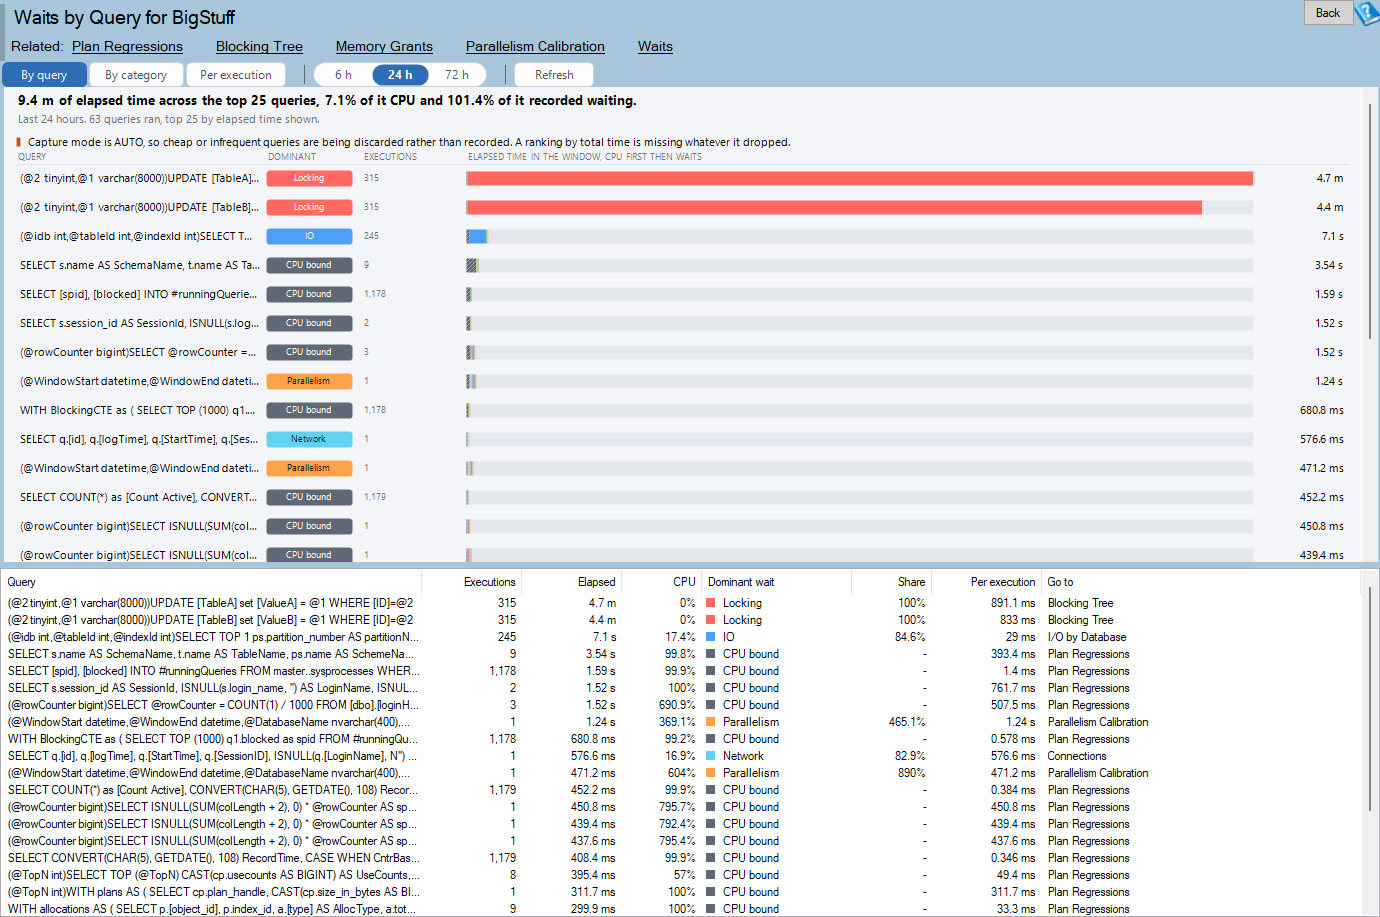
What is wait based tuning in SQL Server, and how do I do it query by query? Wait based tuning starts by splitting one query's elapsed time into CPU and wait categories. Read the Dominant wait and Share columns first. A CPU bound query needs a better plan, while a query mostly in Lock needs a look at what else touches the table. The Go to column names the next report.
Waits by Query is one of the reports in Database Health Monitor. It runs against your own servers, and it takes about a minute to have this same screen open on one of them.
In this post
- Wait based tuning starts at Dominant wait and Share
- What a healthy row looks like
- What a row that needs action looks like
- Three views of the same rows
- Follow the Go to column
- Why the page might be empty
- The units the report keeps straight
Wait based tuning starts at Dominant wait and Share
Your eye will go to the longest bar. Resist that for a moment. The longest bar tells you which query consumed the most time, and you probably knew that already. What you did not know is what the time was made of.
So read two grid columns together. Dominant wait names the largest category for that query, or CPU bound when processor time beat every wait. Share says how much of elapsed time that category accounts for. A dominant wait of Lock at 85 percent is a finding. A dominant wait of Lock at 9 percent is trivia.
The rest of the grid fills in the context, and it reads left to right in a sensible order:
- Query is the procedure name where there is one, and the statement text where there is not.
- Executions and Elapsed tell you how often it ran and the total time across those runs.
- CPU is the processor's share of that elapsed time.
- Dominant wait and Share are the diagnosis.
- Per execution is elapsed divided by executions.
- Go to is the report that owns this shape of problem.

What a healthy row looks like
A healthy row is not one with no waiting. Every query waits a little. What you want to see is a bar that makes sense for what the query does.
A reporting procedure that scans a large table should be mostly CPU, with a modest slice of IO behind it. A short transactional procedure should be a thin bar, because it ran fast. If the bar is long but the split is dull, say a mix of CPU and a little of three categories with none standing out, there is no single villain to chase. Leave it alone.
Some rows are benign by definition. Idle and user waits are the application thinking, and the report gives those rows no destination at all. Do not go looking for a problem the database does not own.
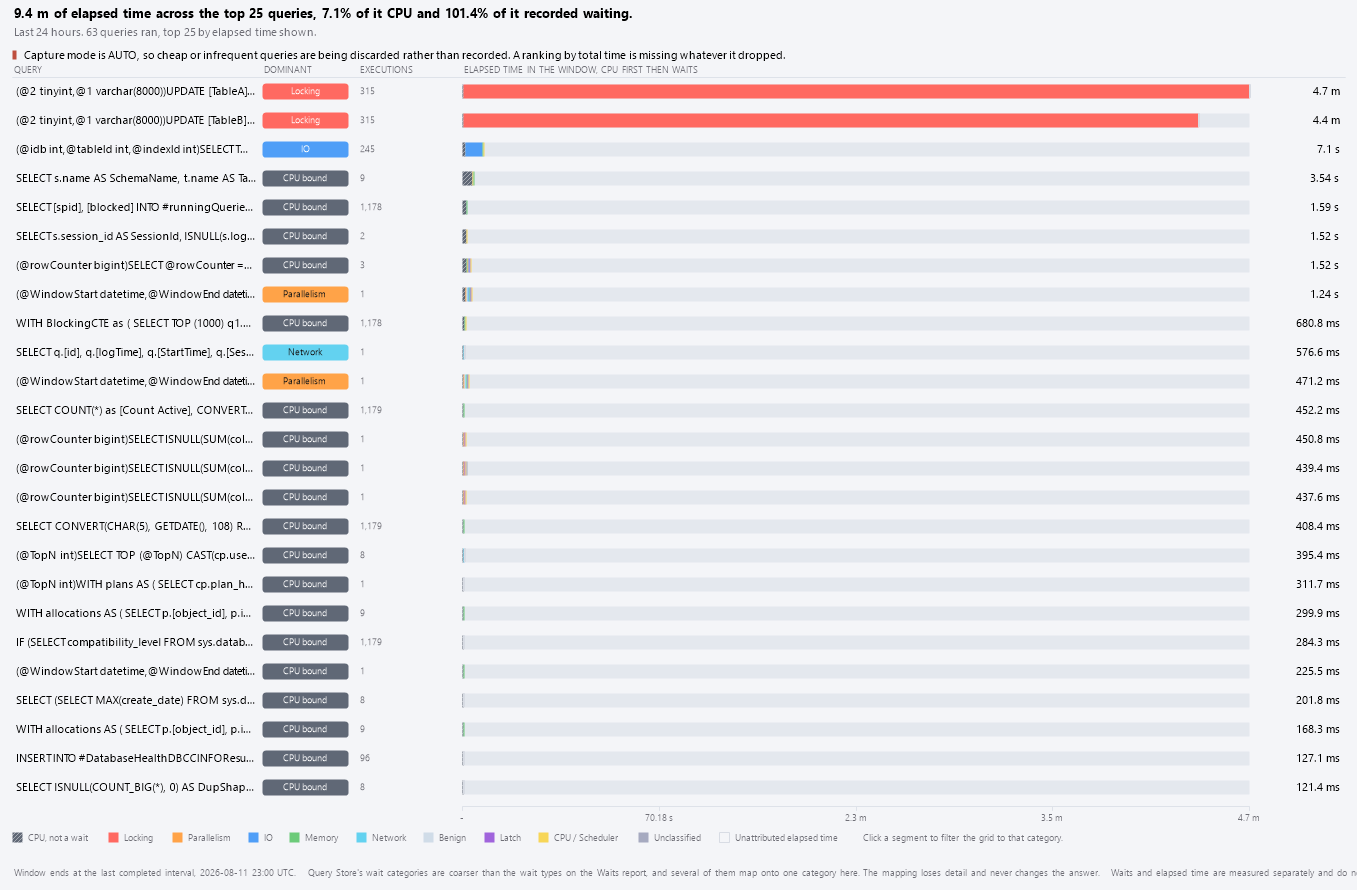
There is one more healthy sign worth knowing. The colored segments will not fill the bar, and that is fine. The outlined segment at the end is the unattributed remainder: waiting Query Store did not categorize, plus the gap between two measurements taken separately. The report draws that gap instead of scaling the segments to hide it.
What a row that needs action looks like
Two shapes matter most, and they call for opposite responses.
The CPU bound bar. The hatched leading segment is most of the bar, and Dominant wait reads CPU bound. This query needs a better plan, so the problem lives in the query and its indexes. One note on the source of that CPU: Query Store puts Compilation in with CPU, because compiling is processor work rather than waiting on a resource. If a CPU bound row suddenly appeared, ask whether it used to be faster. Go to sends you to Plan Regressions for that. If the plan is fine and a loop is the culprit, Finding the Statement Inside a Loop in SQL Server covers the next step.
The Lock bar. The same procedure, but now 90 percent of the bar is Lock. Rewriting it will achieve nothing, because the query is doing its work quickly and then queuing behind somebody else. Go to sends you to Blocking Tree, where the real question is what else is touching that table.
Both guesses, made without this page, cost a day. Made with it, they cost a glance.
Three views of the same rows
The toolbar offers By query, By category and Per execution. Nothing is re-queried when you switch. All three are the same rows arranged differently, and each answers a different question.
| View | Use it to find |
|---|---|
| By query | The query that consumed the most time in the window, and what it was made of. |
| By category | Whether one category dominates every bar, which means the instance has the problem rather than any one query. |
| Per execution | The query that is slow each time it runs, rather than the one that simply runs the most. |
Start with By query. You arrive at this page knowing a query is slow, not knowing a category is big, so starting from the category is backwards. Use By category afterward as a sanity check. If every bar on the page leans Lock, no single procedure is to blame, and you should be at the instance level.
Per execution deserves a visit on any busy system. A query that runs forty thousand times a day at two milliseconds each tops the By query view and means nothing. The one that runs twice and takes a minute each time is the one a user complains about, and only the per execution division shows it.
The window buttons read 6 h, 24 h and 72 h, and the report remembers your choice between sessions. A short window shows what is happening now. A long one smooths away a bad hour. If the page says no query ran in the window, either the database was quiet or the window is shorter than the gap since anything last ran.
Follow the Go to column
Waits tells you the instance spends its life on one wait type. CPU by Query tells you who burns processor. Neither says which query is doing the waiting. This report joins them, and the last column carries the join forward by naming where each dominant wait leads.
| Dominant category | Go to |
|---|---|
| Lock | Blocking Tree |
| Memory | Memory Grants and Spills |
| Parallelism | Parallelism Calibration |
| IO | I/O by Database |
| Transaction Log | I/O by Drive |
| Latch | TempDB Metadata Contention |
| Network | Connections |
| CPU bound | Plan Regressions |
| Benign | Nowhere |
Right-click a row and choose Go to, and the destination report opens. Double-click a row instead and you get the full wait split beside the statement text, along with the guidance the Waits report gives for that category.
Clicking a chart segment is the other shortcut. It filters the grid to queries that waited in that category, and a Clear button appears on the toolbar to undo it. Click a bar and the matching grid row is selected. Right-click the chart and you can copy it as an image for the ticket.
A word on the categories themselves. Query Store has roughly two dozen, and several collapse onto one category here, but none splits. Following a color to the Waits report therefore gives you more detail, never less and never a different answer. Two mappings are judgment calls: Compilation sits with CPU, and Transaction and Log Rate Governor both sit with Transaction Log, since both are waiting on the log to move. What you will not get from Query Store is the individual wait type inside a category. The Waits report has those, for the instance rather than for the query.
Why the page might be empty
Four conditions apply before anything draws. The server must be SQL Server 2017 or newer, because sys.query_store_wait_stats did not exist before it, which is why this node is hidden one version later than its Query Store sibling. Query Store must be on for the database. You need VIEW DATABASE STATE. And WAIT_STATS_CAPTURE_MODE must be ON.
That last one catches people. It is a separate switch from Query Store itself, and it can be OFF while Query Store reports READ_WRITE and looks entirely healthy. The result is a page with no waits, which reads as a database with no waits. Nothing else on the instance raises it.
The page handles it for you. It shows a banner, and the toolbar carries a Turn wait capture on button that displays this statement, asks, and runs it:
ALTER DATABASE [YourDatabase] SET QUERY_STORE (WAIT_STATS_CAPTURE_MODE = ON);
It costs very little, since the waits are aggregated into the intervals Query Store already writes. But nothing is collected retrospectively. After you turn it on the page stays empty until an interval has closed, so do not conclude it failed after a minute.
Where no ALTER DATABASE would help, such as SQL Server 2016 or older, a read only database or the ERROR state, the right-click menu shows the reason as a grayed line rather than an action that could not work. A banner for READ_ONLY Query Store warns that everything below it is history from before collection stopped.
The units the report keeps straight
If you ever build this comparison yourself, one trap will bite. sys.query_store_runtime_stats records duration and CPU in microseconds. sys.query_store_wait_stats records waits in milliseconds. Divide both by the same number and the waits come out a thousand times too small beside the CPU they are being compared against, so every query looks CPU bound.
The report converts both to seconds inside the query, so the two halves cannot be converted differently by two pieces of code. It also filters execution_type on both sides. That column exists on the wait statistics as well as the runtime statistics, and filtering only one puts the waits of a canceled query against the duration of a completed one.
Parallel queries add one more surprise. Eight workers each waiting one second is eight seconds of waiting inside one second of elapsed time. When the waits sum to more than elapsed time, the remainder is floored at zero. Do not read that as a bug.
You will find the report in the tree under a database, at Real Time → Query Store → Waits by Query. The full reference for every column, message and menu item is on the Waits by Query help page. For the instance totals these queries add up to, open the Waits report. For which databases are mostly processor, storage or contention before you open any one of them, try Bottleneck Mix by Database.
What to check on your own server
- Check that WAIT_STATS_CAPTURE_MODE is ON for every database where Query Store is READ_WRITE
- Open Waits by Query on a 24 h window and note the Dominant wait and Share of the top three bars
- Switch to By category and see whether one category dominates every bar, which points at the instance
- Sort by Per execution to find the query that is slow each time, not just the one that runs most
- Use Go to on your worst row to open the report that owns that wait
Try Database Health Monitor Today
Waits by Query shows, for each query, how much of its elapsed time was CPU and how much was waiting, so you stop rewriting queries that were never the problem. Database Health Monitor shows it on every instance you connect, in the time it takes to open the report.
Download Database Health Monitor and run the Waits by Query report against your own server. There is nothing to configure first, and you will know inside a few minutes whether it tells you something you did not already know.