SQL Server Connections: Who Is on Your Database?
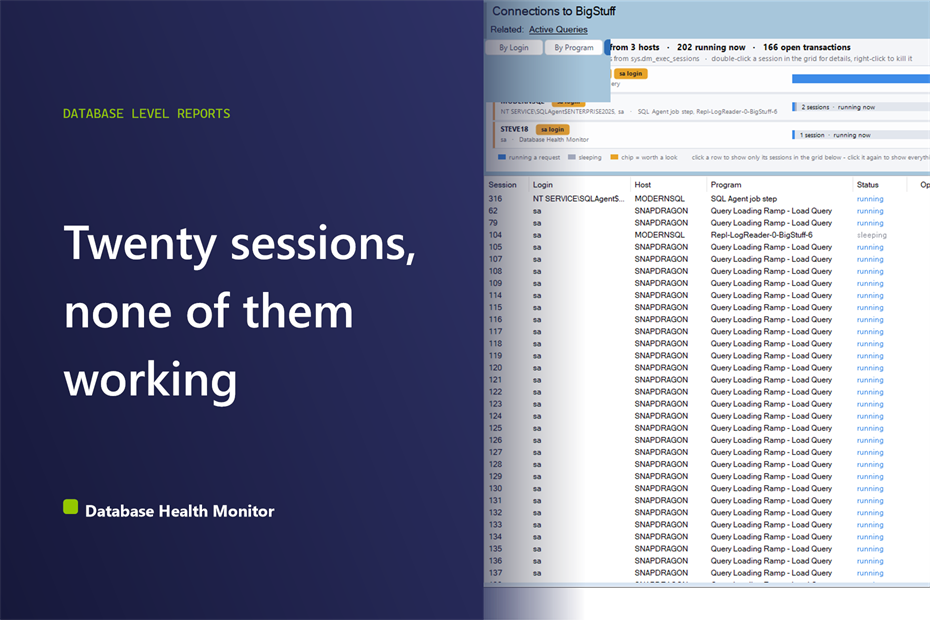
Everything was fine at nine. By ten, queries are queuing behind something nobody can name, and the application team swears they are not running anything. You open a session list and see two hundred rows. Counting SQL Server connections by hand does not tell you which one matters, and that is the real problem.
How do I see which SQL Server connections are idle, holding an open transaction, or logged in as sa? Group your SQL Server connections by login, program or host, then split each group into running and sleeping sessions. A tall bar that is entirely sleeping, with an open transaction inside it, is the one that turns into blocking. Check for sa logins and groups idle for days.
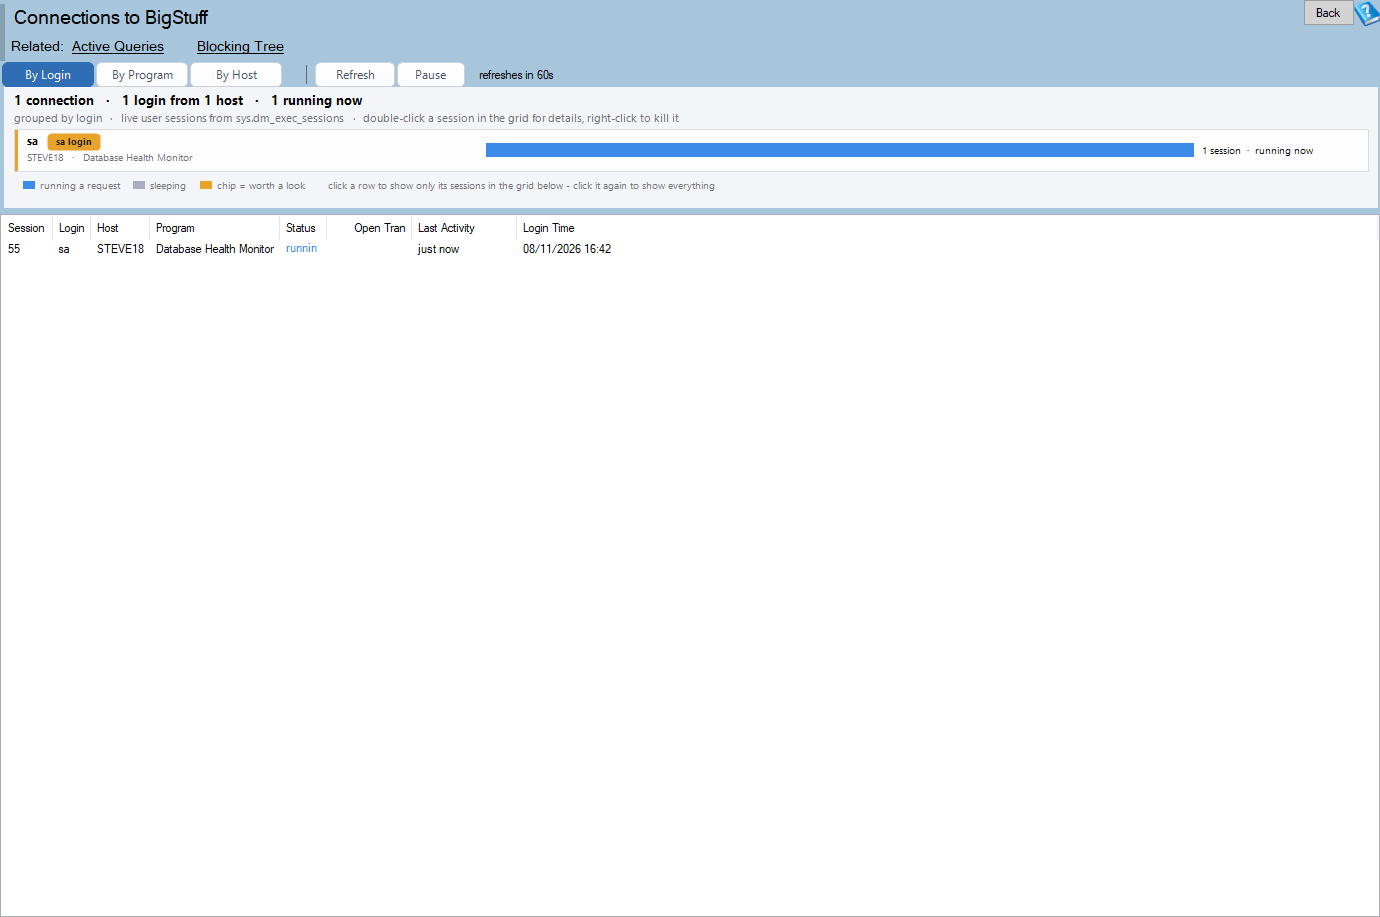
Database Health Monitor answers it with the Connections report: one screen, scoped to the current database, that ranks who is connected and flags the few sessions worth your attention.
Connections is one of the reports in Database Health Monitor. It runs against your own servers, and it takes about a minute to have this same screen open on one of them.
Why a list of SQL Server connections misleads
The usual first move is a query against a session view, or a glance at the old process list. You get rows. You then count them in your head, and you guess.
Three things go wrong. A list leaves the aggregating to you, so four sessions and six sessions look the same. A list says nothing about whether a session matters: one running a query, one holding an open transaction and one asleep for three days all read alike. And the legacy view many tools lean on, sysprocesses, has been deprecated since SQL Server 2005. It filters on spid > 50, which is not what separates user sessions from system ones.
A pie chart of the same data fares no better. Nobody can tell a four-session slice from a six-session slice by angle.
Measure the split, not the count
Twenty connections from an application server is ordinary. Twenty where none are running and the oldest has been idle for three days is a leak. The count is identical. The split between running and sleeping is the honest number.

The report builds each bar from sys.dm_exec_sessions with is_user_process = 1, filtered to the database you are in. SQL Server 2012 or newer uses that path. Older versions fall back to sysprocesses, because it is all they have. You need VIEW SERVER STATE on the instance. Nothing is stored; it is a live picture, and the page refreshes itself on a timer.
The toolbar picks one identity at a time. By Login is where to start, since that is what "who is connected" usually means. By Program helps when one service account covers four applications: one bar by login, four by program. By Host tells you which machine to walk over to.
Three chips decide what to look at
Amber chips mark the groups that deserve a second look. Groups with nothing remarkable get none, which is the point.
| Chip | What it means | Why you care |
|---|---|---|
| Open transaction | A session in the group holds one | This is the one that becomes somebody else's blocking |
| sa | The group connects as sa | On most estates applications should not log in as sa |
| Idle for days | The whole group has been asleep a long time | A leak, not a lull; it costs worker threads and holds locks if a transaction was left open |
The classic pattern is one tall bar, all sleeping, one open transaction. An application opened a transaction and wandered off. Everything blocked behind it is waiting on a session that is doing nothing at all. Finding that session takes seconds here, instead of a hunt through a process list.
The sa chip is not an accusation. It is a prompt for a conversation, whatever the session happens to be doing.
From a bar to a decision
Click a bar and the grid filters to that identity. Click again to clear. The columns are Session, Login, Host, Program, Status, Open Tran, Last Activity and Login Time. Program names are normalized, so an Agent job step reads as the job rather than a hex id.

Read those two columns together. A sleeping session with Open Tran above zero and a Last Activity from yesterday is your culprit. A sleeping session with zero open transactions is just a pooled connection waiting for work.
- One host, many sessions, mostly sleeping: a connection pool. Normal, and its size is a setting in the application's connection string.
- Many hosts, one session each: direct client connections, usually a reporting or admin population.
- A group idle for days: connections nobody closed.
Kill Session sits on the right-click menu. It names the session and asks first, and everything else on the page only reads. Still, look at the individual sessions before you use it.
If the open transaction has already produced a queue, the next question is what the waiters are stuck on. Wait Based Tuning: Which Part of the Bar to Read First covers reading waits for the queries on a database. For the full column and setting reference, see the Connections documentation.
This is the database scope report. The instance report of the same name covers every physical connection, with transport and security columns. This one answers a narrower question, and the better one at ten o'clock: who is on this database, and are they doing anything?
What to check on your own server
- Group your database's sessions by login first and note which bars are entirely sleeping
- Look for the Open transaction chip and read that group's sessions before touching anything
- Switch to program grouping wherever one service account covers several applications
- Find every group carrying the sa chip and ask who owns it
- Select a bar and read the individual sessions before you use Kill Session
Try Database Health Monitor Today
Connections shows who is on a database and which sessions hold an open transaction, run as sa or have sat idle for days. Database Health Monitor shows it on every instance you connect, in the time it takes to open the report.
Download Database Health Monitor and run the Connections report against your own server. There is nothing to configure first, and you will know inside a few minutes whether it tells you something you did not already know.