SQL Server Missing Indexes: Read Write Cost First
A query that ran in 200 milliseconds in spring now takes four seconds, and the plan shows a scan over a table that has quietly grown to forty million rows. Somebody on the team says the server is missing an index. Fine. But which one, on which table, and what will it cost every insert afterward? SQL Server missing indexes advice is easy to get and surprisingly hard to trust.
How do I decide which SQL Server missing indexes are worth building? Compare each suggestion's benefit against the write cost of its table. SQL Server missing indexes come from DMVs that return many near-identical suggestions, ignore indexes you already have, and reset on restart. Consolidate the duplicates, check how long statistics have accumulated, then build only large-benefit suggestions on tables that are not heavily written.
Database Health Monitor has a Missing Indexes report built for exactly that gap. It reads what SQL Server recorded, cleans it up, and puts the read benefit next to what the index would cost your writes. This post explains why the raw list misleads, what to measure instead, and how to work through the report on a real instance.
In this post
- Why raw SQL Server missing indexes advice misleads
- Write cost is the number that decides
- What the report puts on screen
- Reading the grid, column by column
- Consolidation, and why you should see the raw list once
- Three patterns that change what you do next
- A sensible order of work
Why raw SQL Server missing indexes advice misleads
Every time the optimizer plans a query and wishes it had a better index, it writes a note. Those notes live in three DMVs: sys.dm_db_missing_index_details, sys.dm_db_missing_index_groups and sys.dm_db_missing_index_group_stats. Query them directly and you get a flat list. It looks authoritative. It is not ready to act on.
Three things go wrong.
- Duplication. One table commonly collects eight to thirty suggestions that differ by a column or an include. Build them all and you have thirty indexes where one would do.
- Blindness to what exists. The DMV records what the optimizer wanted. It never checks whether the table already has an index leading with that same column. Often the right fix is to widen an index you own.
- No price tag. An index that saves a great deal of reading is a bargain on a table nobody writes to. The same index on a table taking a hundred thousand writes is a different purchase entirely, and the DMV says nothing about it.
There is a fourth problem, and it is time. These statistics sit in memory and are wiped by a service restart. A suggestion with enormous benefit on an instance that came up an hour ago describes one hour of workload. It might be a nightly job that happened to run. It might be a one-off report somebody ran at lunch.
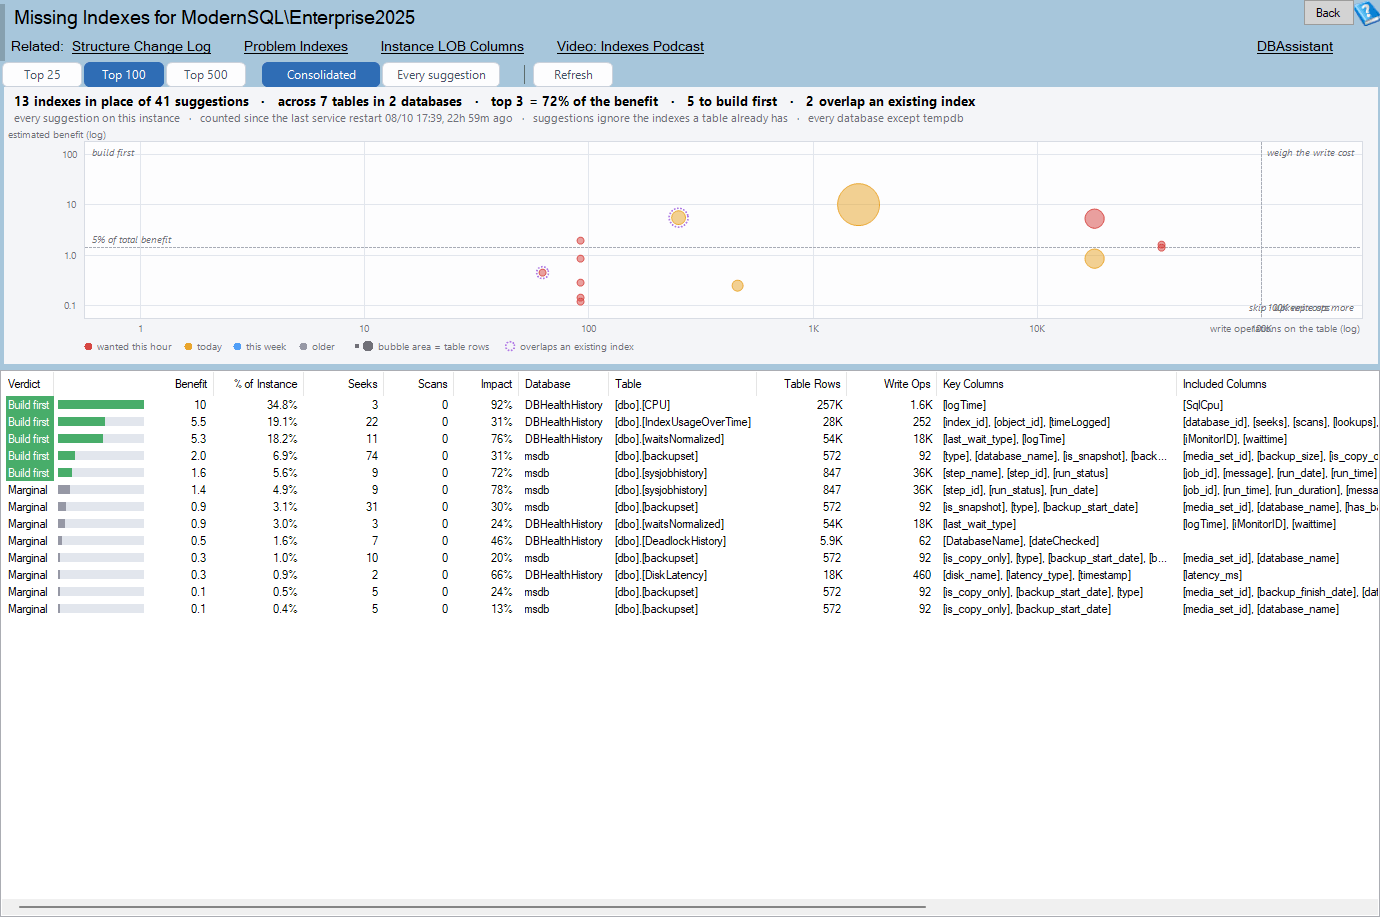
Missing Indexes is one of the reports in Database Health Monitor. It runs against your own servers, and it takes about a minute to have this same screen open on one of them.
Write cost is the number that decides
Most people sort the raw list by estimated impact and start at the top. That ranks suggestions by how much reading they would save. It ignores the other half of the bargain. Every nonclustered index you add has to be maintained on each insert, update and delete that touches its columns. On a lookup table that changes twice a year, that cost is invisible. On an orders table under constant load, it can eat the gain you were chasing.
So the honest comparison is benefit against write cost, and it has to be made per table. The report does this with two thresholds. A suggestion is a real contender when it holds 5% or more of the instance's total benefit. A table counts as heavily written at 100,000 write operations. Cross those two lines and every suggestion lands in one of four verdicts.
| Verdict | Benefit share | Table writes | How to treat it |
|---|---|---|---|
| Build first | 5% or more | Not heavy | A real slice of the reading on a quiet table. Start here. |
| Weigh it | 5% or more | Heavy | Worth having, but measure the write overhead before committing. |
| Skip | Under 5% | Heavy | Small gain, expensive upkeep. Usually a net loss. |
| Marginal | Under 5% | Not heavy | Only worth it if the index is cheap to build. |
Treat the verdict as a sorting aid, not an order. It gives you a sensible place to begin on a list that arrives in no meaningful sequence. The decision still belongs to you.
What the report puts on screen
Open it from the server tree under Instance Level Reports, or from the link on the Server Overview page. The same report scoped to a single database lives on the Database Overview. It covers every database except tempdb, whose object ids do not outlive the objects they name, so a suggestion there cannot be tied reliably to a table.
master, model and msdb are included, and that matters. A missing index on msdb.dbo.sysjobhistory is a common finding on an instance with a lot of Agent jobs, and a tool that skips system databases never shows it to you.
The page reads the DMVs once, instance-wide, using the database_id they already carry. There is no loop through every database. It then visits only the databases that actually appear in the results to collect row counts and existing index information, so the cost is the same on an instance with four hundred databases as on one with four. On a slow instance a loading panel appears after about four hundred milliseconds and counts suggestions as they arrive, so the window never freezes.
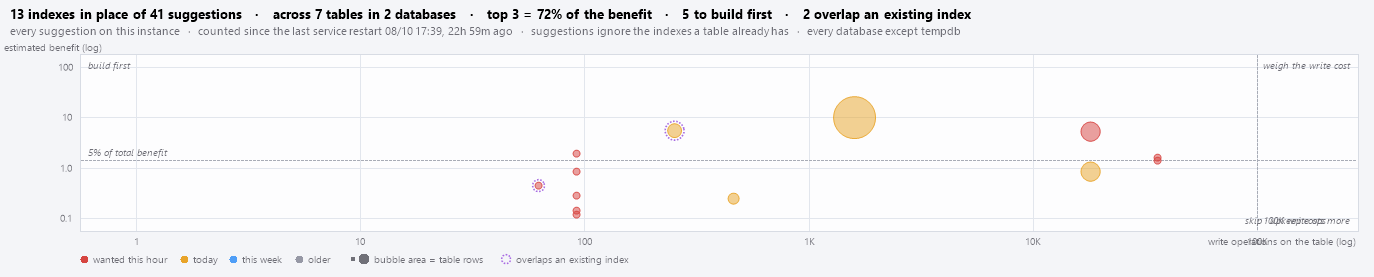
The chart is the fast read. Benefit runs along one axis, write cost along the other, and the four quadrants are the four verdicts. Point size carries the size of the benefit. You do not need to sort anything: the corner you care about is a corner. A big dot there is your first candidate, and a cloud of small dots in the heavy-write half is mostly noise.
Two header lines worth reading before the chart
The summary line gives you counts: how many consolidated suggestions across how many tables, how much of the benefit the top three hold, how many are first-build candidates, how many sit on write-heavy tables, and how many overlap an index the table already has. That last figure is the one the raw DMVs cannot produce. Nine overlaps out of forty-one usually means nine suggestions you can dismiss without a second look.
The subtitle carries the caveats. It tells you how many suggestions were returned out of the total, how long ago the service restarted, that suggestions ignore existing indexes, and that every database but tempdb is covered. When an instance holds a very large number of suggestion groups, it adds a warning. That warning is a finding on its own, and I come back to it below.
Reading the grid, column by column

The grid follows the chart, so the same ideas show up as columns. The first few tell you what and where: Verdict, Benefit with a bar inside the cell, % of Instance, Database and Table. Then comes the definition, Key Columns and Included Columns, placed right after the table name so it stays visible on a 1200 pixel wide display.
After the definition come the numbers behind the verdict. Seeks and Scans count the operations the optimizer would have routed through the index. Impact is the average user impact, correctly scaled as a percentage. Table Rows lets you judge whether the claimed benefit is plausible, and Write Ops is the cost side of the ledger. Last Wanted and Notes round it out.
Two columns deserve more attention than they usually get.
Key Columns are ordered the way the index has to be built. The DMV hands back equality columns and inequality columns in separate lists. Concatenate them in the order returned and you get an index that does not do what the optimizer asked for. The report puts the equality columns first and rebuilds the order for you. If you ever doubt a key order, the right-click menu opens a cardinality report for the table, which is what drives the choice.
Last Wanted is the date the optimizer last wished for the index. A suggestion it has not wanted for three weeks describes a query that no longer runs. Discard it, however large the benefit looks.
Consolidation, and why you should see the raw list once
The toolbar offers Top 25, Top 100 and Top 500, plus a choice between Consolidated and Every suggestion. Consolidated is the default. It merges near-identical suggestions on a table into the one index that covers them. Switch to Every suggestion once, on a table where you have seen a dozen variations, and the reason for consolidation becomes obvious.
The merge keys on database as well as table. That sounds like a detail until you have two databases sharing the same schema, such as a tenant database per customer. Merging by table name alone would produce a suggestion that belongs to neither.
Right-click a row and Show Missing Index Advisor opens a dialog for that suggestion. The left side builds the CREATE INDEX statement from the equality, inequality and included columns. The right side is an index review of the table. It lists overlapping suggestions, reads against writes for each existing nonclustered index, fragmentation over 10%, unused indexes, duplicates, disabled indexes, heaps, low fill factors and foreign keys with no supporting index. A section that fails, for example for lack of VIEW SERVER STATE, shows its error and leaves the rest readable.
That review is the quickest way to answer "should I add this, or change something I already have?" Each section can produce a ready-to-run script under a USE line, and you can copy one script, several, or all of them.
Three patterns that change what you do next
After a few runs you start to recognize shapes.
- One suggestion holds most of the benefit. Usually a genuine win. Confirm Write Ops and Table Rows look sane, then build it.
- High benefit and high write ops. This is the Weigh it quadrant. The index will help reads and tax writes. On a hot OLTP table the upkeep can outweigh the gain, so measure first.
- Many suggestions carrying an existing-index note. The table is already over-indexed and the optimizer wants variations. Look at changing the key order or include list of an existing index rather than adding another.
One more pattern sits outside the grid. If the subtitle warns about an enormous number of suggestion groups across the instance, stop tuning individual indexes. That usually means an application is sending ad hoc SQL with literals baked in rather than parameters, which also bloats the plan cache. Fix the application first. Indexing around it only treats the symptom.
It is also worth knowing that a missing index widens the range of rows a statement has to touch, and a wider range means more locking. If you are chasing collisions, Find the SQL Server Deadlock Objects That Keep Colliding pairs well with this report: a table that shows up in both is a strong candidate for attention.
A sensible order of work
Do the cheap sanity checks before you trust any number.
- Check how long the statistics have been accumulating. The subtitle states it. A short window makes everything else meaningless.
- Read the summary line. If the top three suggestions hold most of the benefit, you have a few real wins. If it is spread thin, you have a long tail of noise.
- Look at the Build first corner of the chart and note the large points.
- Check Write Ops before committing to any of them. Benefit alone was never the decision.
- Read the Notes column for an existing index that already leads with the same column.
- Check Last Wanted to drop anything describing a query that has stopped running.
- Open the advisor on the survivors and read the generated
CREATE INDEXbefore you run it.
The report is also honest about its limits. Nothing is stored; the data lives in memory and resets with the service, so if every suggestion vanishes overnight the instance restarted. If a lookup times out on an instance with a great many databases, drop to a smaller Top N and try again.
Adding indexes is only half of tuning, because the other half is deciding what to give up. The related Unused Indexes and Duplicate Indexes reports show what you can drop to pay for what you add, and CPU by Query shows which queries would benefit. For the full column reference and every menu item, see the Missing Indexes documentation.
What to check on your own server
- Check how long ago the instance restarted, because missing index statistics start from zero at every restart
- Switch the suggestion list to consolidated so near-identical suggestions collapse into one index per table
- Compare Write Ops against benefit for each candidate, and hold back anything on a table with 100,000 or more writes
- Read the Notes column for an existing index that already leads with the same column before adding a new one
- Check Last Wanted and read the generated CREATE INDEX statement before you run it
Try Database Health Monitor Today
It sorts the eight to thirty near-identical missing index suggestions per table into build, weigh, skip and marginal, so you stop guessing which ones are worth their write cost. Database Health Monitor shows it on every instance you connect, in the time it takes to open the report.
Download Database Health Monitor and run the Missing Indexes report against your own server. There is nothing to configure first, and you will know inside a few minutes whether it tells you something you did not already know.