msdb suspect_pages: Read the Date Before the Count
You open the Suspect Pages report and a row is sitting there. Is it this morning's problem, or a leftover from a disk that was replaced in 2021? The table behind the page, msdb suspect_pages, cannot answer that by itself, and the biggest number on screen is the wrong place to start. Database Health Monitor draws the table as a short grid with a bar chart above it, and the column that settles the question is Last Updated. Everything else only means something once you know how old the row is.
What does msdb suspect_pages tell you about damaged pages in SQL Server? The msdb suspect_pages table is where SQL Server records every page it failed to read correctly, with an event code, an error count and a last updated time. Read the last updated time first, then the event to separate damage from a restore or repair, then the error count to see whether the page is still failing.
In this post
- The question this page exists to answer
- Read Last Updated first
- Then Event, then Error Count, then the rest
- What a healthy msdb suspect_pages reading looks like
- What a reading that needs action looks like
- The drill down and where it leads
- Two traps in the table itself
The question this page exists to answer
SQL Server writes a row to msdb..suspect_pages whenever it reads a page and does not like what it finds. Then it carries on with the query. No alert fires. No icon turns red. The only other trace is a line in the error log, and that scrolls away.
So the question is narrow. Did the engine trip over a page on this instance, and has anybody dealt with it? That is not the same as asking whether a database is corrupt. That is a bigger question, and only DBCC CHECKDB answers it.
You find the report under Instance Level Reports: right-click the server, then choose Suspect Pages. Reading the table takes db_owner on msdb or sysadmin. Nothing on the page changes anything, and that is deliberate. Every real fix is a restore or a DBCC command with consequences, and none of those belong behind a right-click.
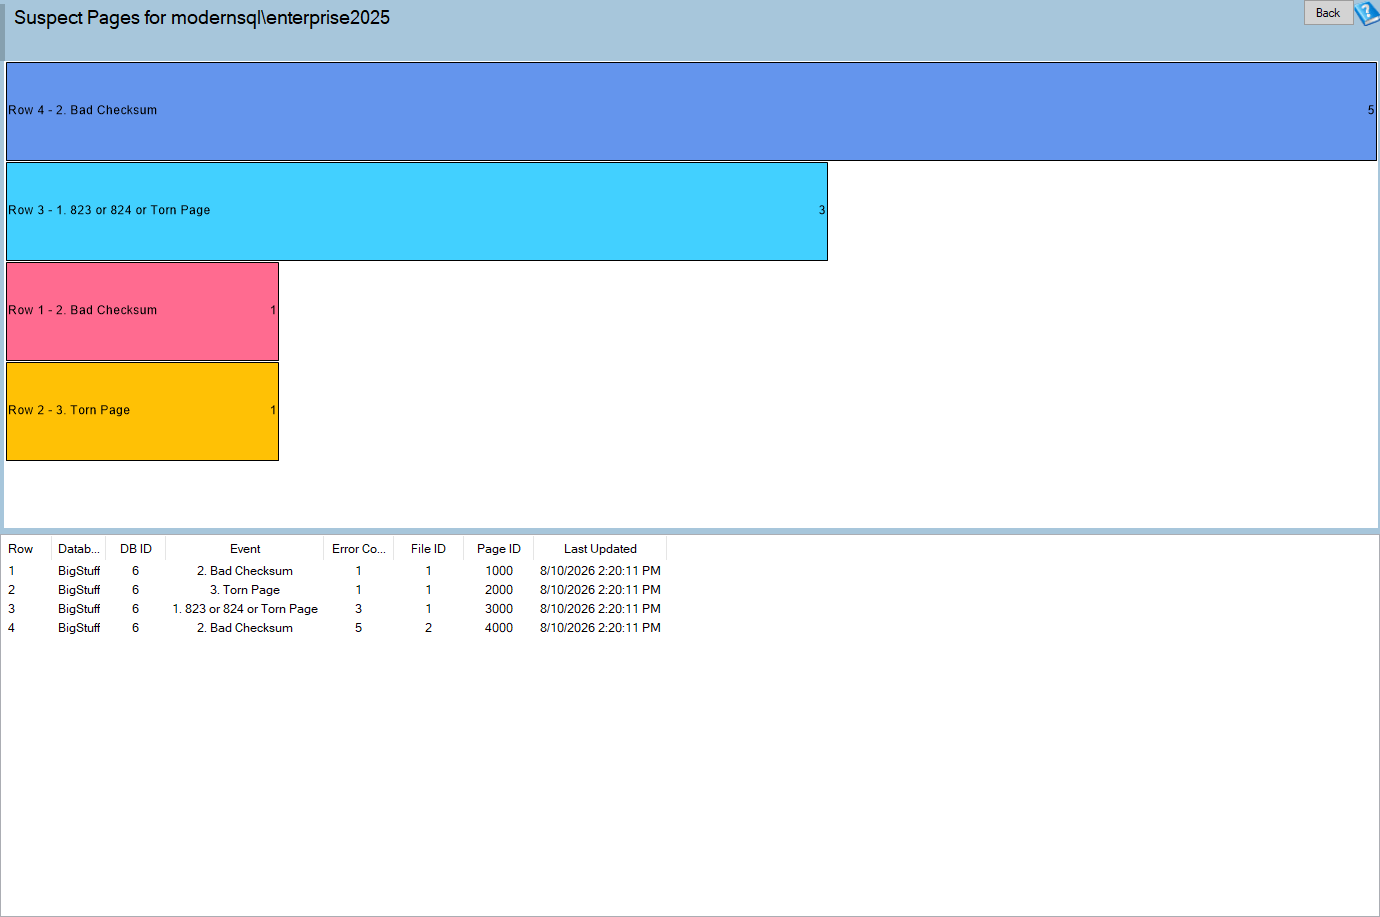
Suspect Pages is one of the reports in Database Health Monitor. It runs against your own servers, and it takes about a minute to have this same screen open on one of them.
Read Last Updated first
Rows come sorted by Last Updated, newest first. Read that column before any other one.
The tempting move is to go straight to the biggest Error Count, because it looks like a severity score. It is not one. A count of 40 from 2019 is history. A count of 1 from last night is an open incident. The count only means something once you know when it stopped growing, or whether it stopped at all.
Last Updated is the moment the row was last written. A page that keeps failing keeps getting its row touched. A page that failed once and never again leaves a date that just sits there getting older. Between them, that one column separates a live problem from a memory.
Then Event, then Error Count, then the rest
Once the date tells you the row is recent, read Event. It has six possible values, and they fall into two groups that matter more than any individual code.
| Event | Group | What it means |
|---|---|---|
| 1. 823 or 824 or Torn Page | Damage | A read failure from the operating system, or a checksum or torn page problem. The general case and the most common. |
| 2. Bad Checksum | Damage | The page changed after SQL Server wrote it. That points at storage, not at SQL Server. |
| 3. Torn Page | Damage | The write finished only partly, typically a power loss or a controller fault mid write. |
| 4. Restored | Outcome | A restore replaced the page. Good news. |
| 5. Repaired (DBCC) | Outcome | DBCC CHECKDB with a repair option fixed it. |
| 7. Deallocated (DBCC) | Outcome | A repair option threw the page away. Data was lost. |
Events 1, 2 and 3 are damage. Events 4, 5 and 7 are outcomes. A damage row with a later outcome row behind it has been handled. A damage row standing alone has not.

Next comes Error Count. A count above one means something keeps reading that page and keeps failing. That is not a historical fact, it is a live one, and it moves the row to the top of your afternoon.
Then Database and DB ID. The name is resolved from the ID, so it comes back blank when the database has been dropped or detached. That is why the ID is shown as well. A blank name beside a filled-in ID means the row is history for a database that no longer lives here.
Last, File ID and Page ID. They say where the page is, not what it belongs to. The report does not name a table. DBCC PAGE, or the output of DBCC CHECKDB, is what turns a file and page number into an object, and the Files report tells you which physical file that ID actually is.
What a healthy msdb suspect_pages reading looks like
Empty. The report says so in plain words instead of drawing a blank chart, and on most instances that is what it will say for years. If you open it and see nothing, there is no catch. It is the right answer.
A few non-empty readings are also fine once you have read them properly:
- One row, event 2, count 1, months old. A single bad checksum that never came back is usually a transient storage glitch. Confirm that
CHECKDBhas run clean since, then leave it. - A damage row with a restore or repair row after it. Somebody dealt with it. The original row stays behind because fixing a page adds a new row rather than removing the old one.
- A blank Database name with a DB ID. The database was dropped or restored elsewhere. The row is history.
What a reading that needs action looks like
Three shapes should stop you.
Recent date, count above one. Something is reading the page right now and failing every time. If you want to see what is connected at the moment, Who Is Connected to SQL Server, and What They're Doing covers the live view.
Several rows in one database over a few days. One bad page is a glitch. A cluster points at a failing disk or controller. Open I/O by Drive and Disk Latency by Hour by Day, and the same volume is usually misbehaving there too.
Any event 7 row, even an old one. Deallocated means REPAIR_ALLOW_DATA_LOSS discarded the page so the database would pass its consistency check. Somebody chose to lose whatever was on it. Find out which table it was, and whether anyone ever reconciled the gap.
When the page is not empty and the date is recent, the order of work matters:
- Back up first. A damaged database that still runs is one you can still pull data out of. Do not skip this step.
- Open the Error Log report. It sorts out the 823, 824 and 825 entries and shows what surrounds them. Error 825 is the quiet one: it means a read worked only on a retry, which is storage warning you ahead of time.
- Run
DBCC CHECKDB. The suspect pages table only lists what the engine stumbled on.CHECKDBtells you how far the damage really goes. - Favor restoring just the pages. Under
FULLrecovery with an unbroken log chain, a page level restore loses nothing. Backup Status shows the chain.REPAIR_ALLOW_DATA_LOSScomes last, and the name is accurate. - Then go and look at the hardware. Bad checksums and torn pages are storage faults. The database is only where you noticed.
The drill down and where it leads
This report is a starting point, and every row has somewhere to go next.
| Report | The question it answers |
|---|---|
| Error Log | What did the 823, 824 and 825 entries say around the time the page failed? |
| Last DBCC CheckDB Known Good by Database | When was this database last verified clean? |
| Backup Status | Is the log chain intact, so a page level restore is possible? |
| I/O by Drive | Which volume holds the failing file, and how is it behaving? |
| Disk Space | What is the state of the volume itself? |
| Files | Which file is the File ID in this row? |
A good sequence is the Files report to name the file, I/O by Drive to see the volume, then Last DBCC CheckDB Known Good by Database to learn how long the database has gone without a clean check. By then the row has stopped being a number and become a place.
Two traps in the table itself
The table holds at most 1000 rows. Once it is full, SQL Server stops adding to it. On an instance with a genuinely failing disk that means the table can go quiet while the damage carries on, and a quiet table is no proof of a quiet disk.
The second trap is that nothing ever cleans it. A fault repaired three years ago is still there beside last night's row. Clearing handled rows is a manual DELETE against msdb..suspect_pages, and it is worth doing, so the next person who opens the page sees only what is current. The report will not do it for you, by design.
Nothing on the page is stored or cached, either. You are looking at the table as it stands at that moment, ordered by last_update_date descending, with DB_NAME() supplying the name. For the complete column reference, see the Suspect Pages documentation.
What to check on your own server
- Open the Suspect Pages report on each instance and note whether it comes back empty
- Sort by Last Updated and separate rows from this month from rows that are years old
- Match every damage row against a later restore, repair or deallocation row for the same file and page
- Check any Error Count above one against the error log entries from the same period
- Delete rows that were dealt with so the next reader sees only current problems
Try Database Health Monitor Today
It reads the damaged-page table SQL Server fills in silently, so you can tell a repaired page from one that is still failing. Database Health Monitor shows it on every instance you connect, in the time it takes to open the report.
Download Database Health Monitor and run the Suspect Pages report against your own server. There is nothing to configure first, and you will know inside a few minutes whether it tells you something you did not already know.