What’s New in Database Health Monitor 4.1626: Index Consolidation, Service Broker, Data Protection, Analysis Services and a Web Dashboard
Database Health Monitor 4.1626 adds an Index Consolidation Plan that turns your existing indexes and your missing index suggestions into one ordered script with a matching rollback, three new reports covering Service Broker, data protection and Analysis Services, and an opt-in read-only web dashboard served by the monitoring service. The release contains 3 new reports (5 pages), 9 new features and 278 bug fixes, including 9 crashes and 30 fixes in Azure SQL Health Monitor.
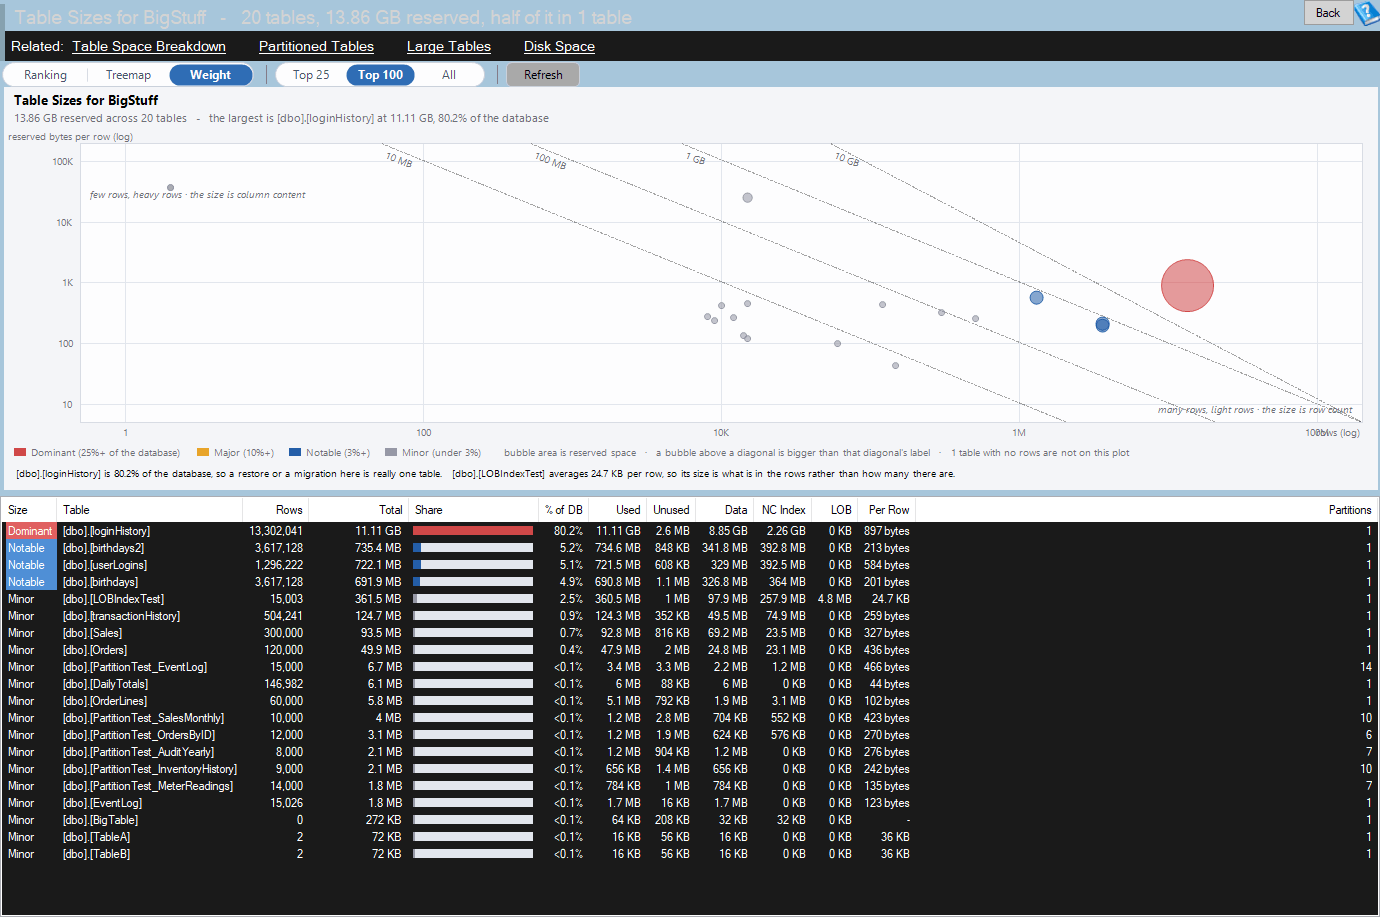
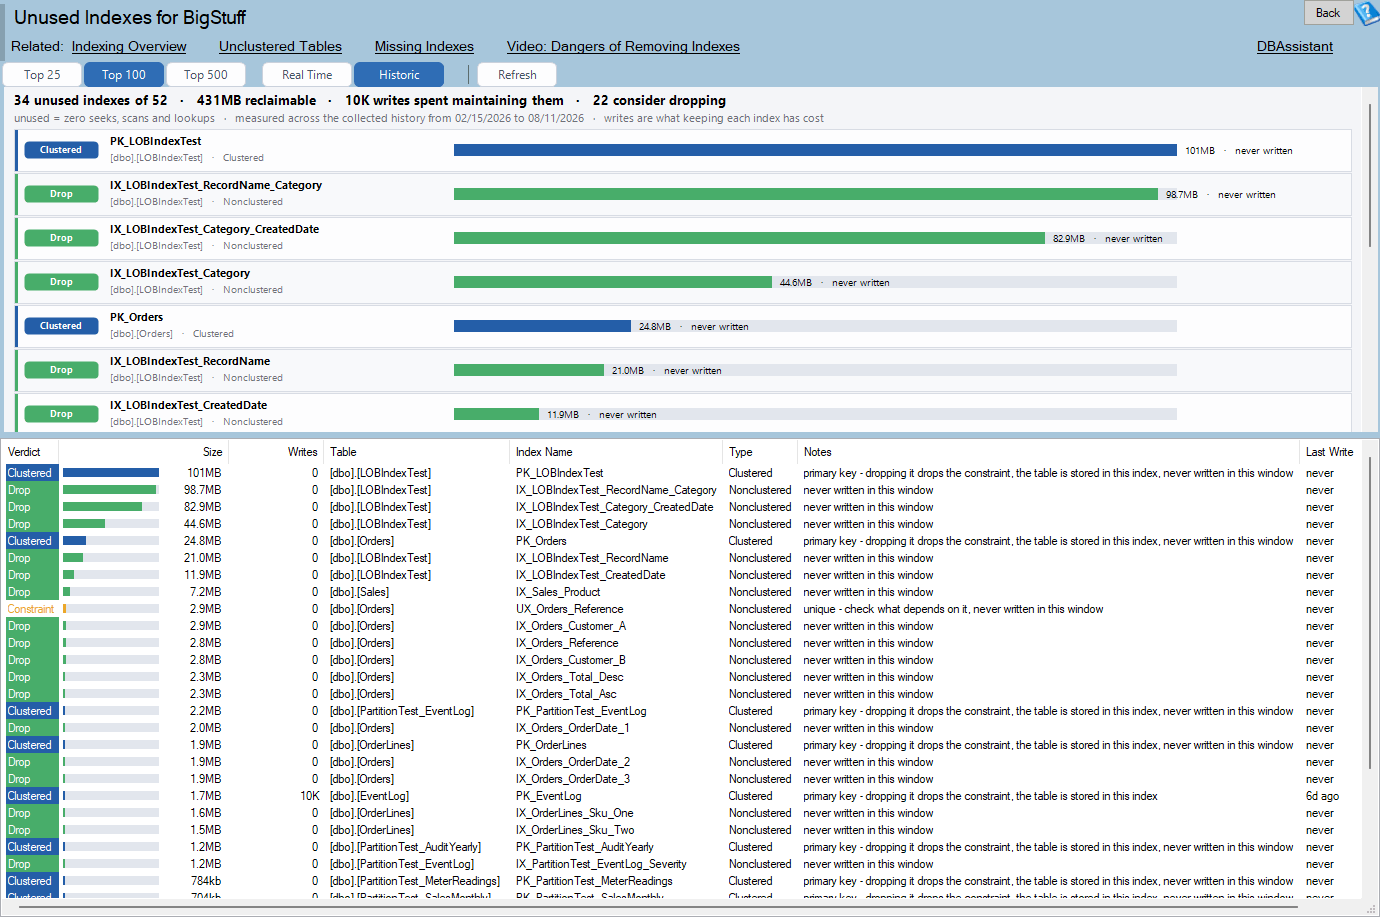
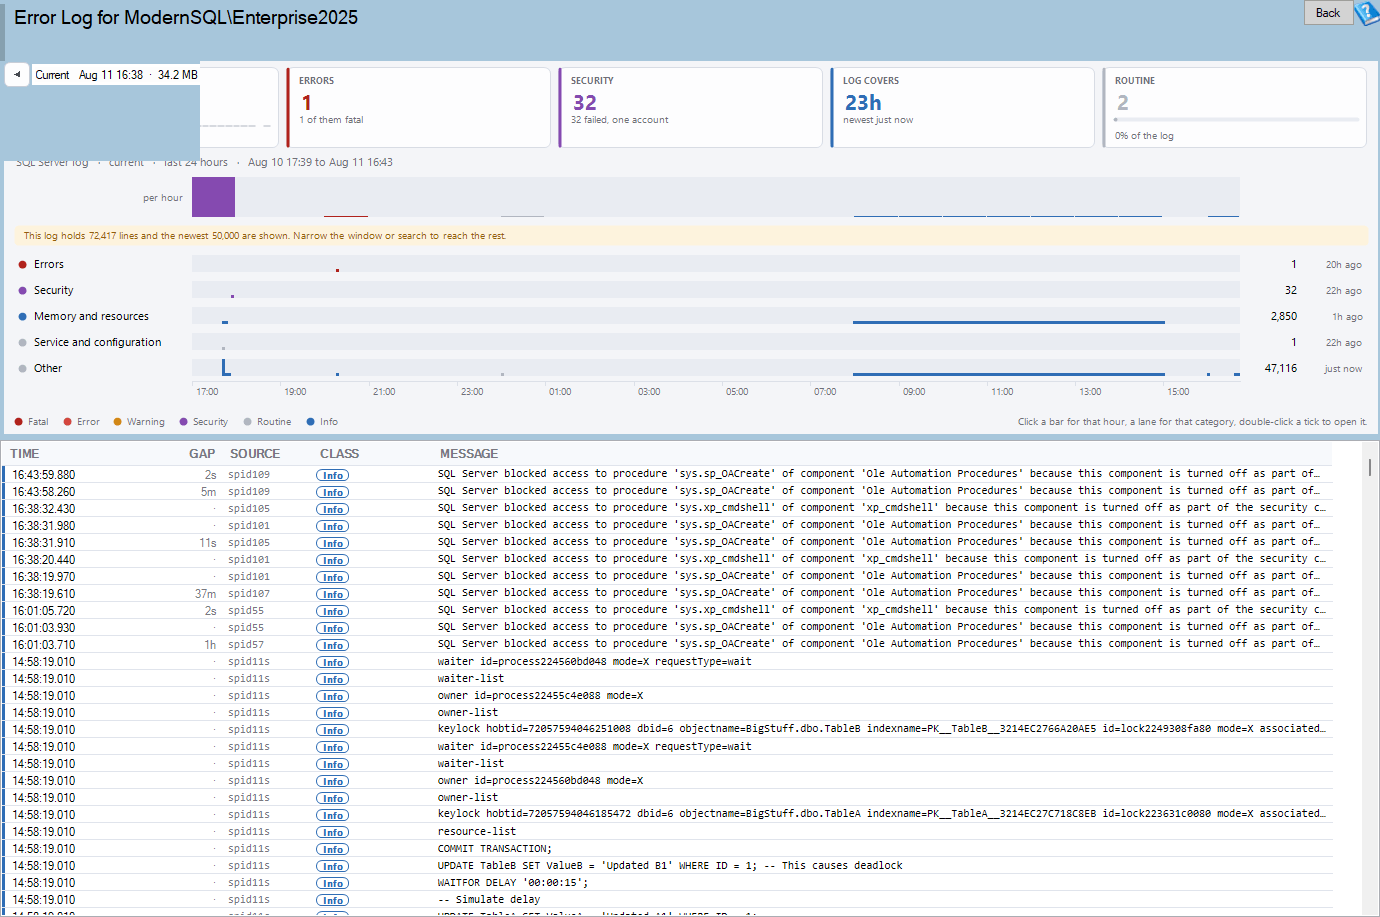
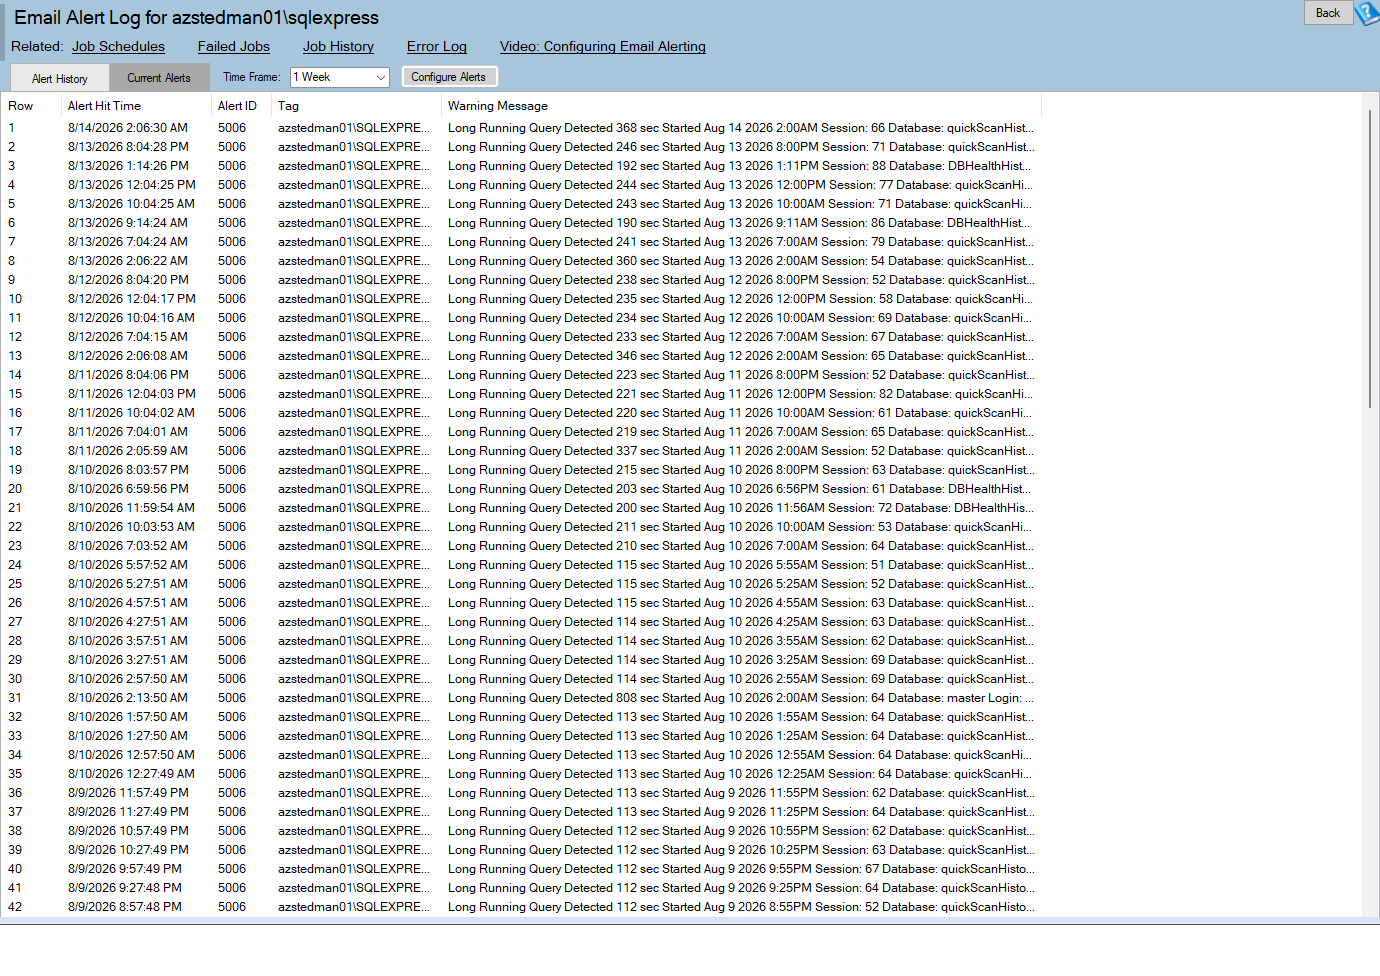
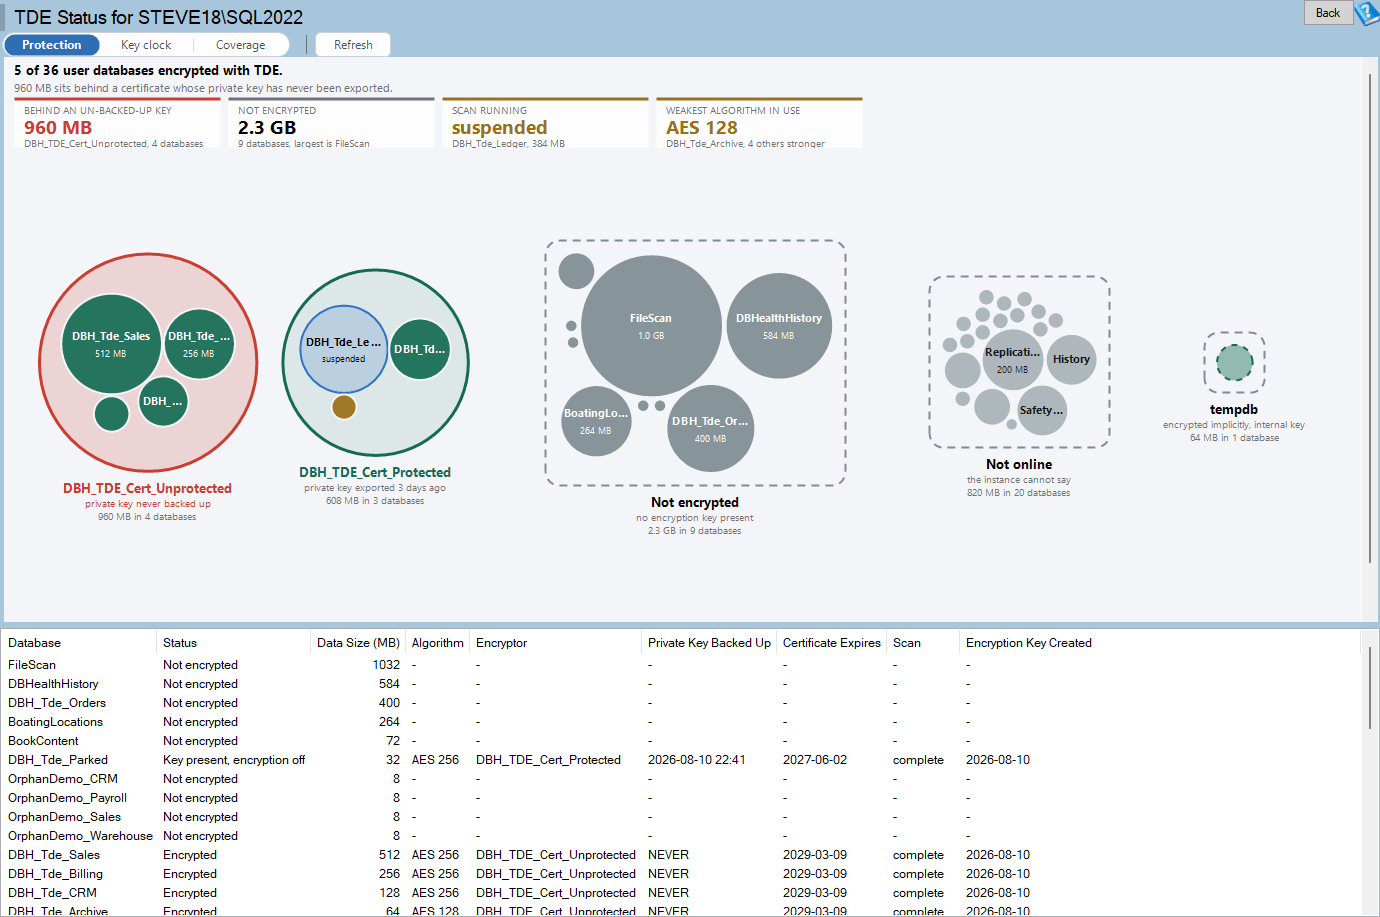
This post goes through each item with the detail you need to use it: the columns, the thresholds, the finding names and severities, the catalog views and DMVs that are read, and what each script does and does not do. Where a new report has no screenshot yet, the image shown is a related existing report, and the caption says so.
Index Consolidation Plan
The other indexing reports each list one kind of finding: missing index suggestions, duplicate indexes, unused indexes. Acting on each list on its own is how a table ends up with nine overlapping indexes. The Index Consolidation Plan is the step after them. For every table in one database it weighs the existing indexes and the suggestions together, works out the smallest set of changes, estimates what those changes cost and save, and writes one script with a matching rollback.
Nothing on this page changes the database. It writes scripts, and running them is up to you. It is a database level report from SQL Server 2008 onward. Select a database in the tree, open Real Time, then Indexing, then Index Consolidation Plan.
The five actions
Every row in the plan carries one of five actions.
| Action | What it means |
|---|---|
| CREATE | A suggestion that nothing serves becomes a new index, named IX_<Table>_<Key1>_<Key2>. |
| WIDEN | An existing index already has the keys a suggestion needs, so it takes the extra included columns (or, when it is not unique, the extra trailing equality keys) instead of a new index being created. It keeps its name, so index hints still work. |
| MERGE | Two non unique indexes where one’s keys lead the other’s: index (A) is merged into (A, B), which takes the union of the included columns, and (A) is dropped. |
| DROP | An exact duplicate (the copy kept is the one the Duplicate Indexes report keeps), or an index with no seek, scan or lookup since SQL Server started. |
| KEEP | An index that already covers one or more suggestions. Nothing to do; the request most likely predates the index. |
Reading the page
The heading gives the uptime that the usage numbers cover, then two summary lines. The Plan line describes the default plan: the tables touched, the count of each action, the index count before and after, the estimated size added and removed, and the estimated writes per day added and removed. The Selected line gives the same totals for the rows that are ticked, and it always equals the sum of the ticked rows.
| Column | What it is |
|---|---|
| Tick | Whether the row goes into the scripts. CREATE, WIDEN and MERGE are ticked by default. A DROP is ticked only when its verdict is Safe. Blocked rows cannot be ticked. |
| Table | The table. |
| Action | CREATE, WIDEN, MERGE, DROP or KEEP. |
| Verdict | Safe, Review (worth a look before running) or Blocked (never scripted). |
| Index | The index acted on, or the name of the new index. |
| Detail | The keys and includes of a new index, what a WIDEN adds, what a MERGE folds in, or why a DROP. |
| Size (est.) | Estimated size added or removed. |
| Writes/day | Estimated write operations a day added or removed. For a new index this is the table’s own write rate, an upper bound, and it is marked “max”. |
| Benefit | The summed benefit of the suggestions the row serves, the same score the Missing Indexes report uses. |
Select a row to see its reasoning in the side pane: the suggestions it serves, the index it replaces, the seeks, scans, lookups and updates since the restart, the warnings, and the statements for that row.
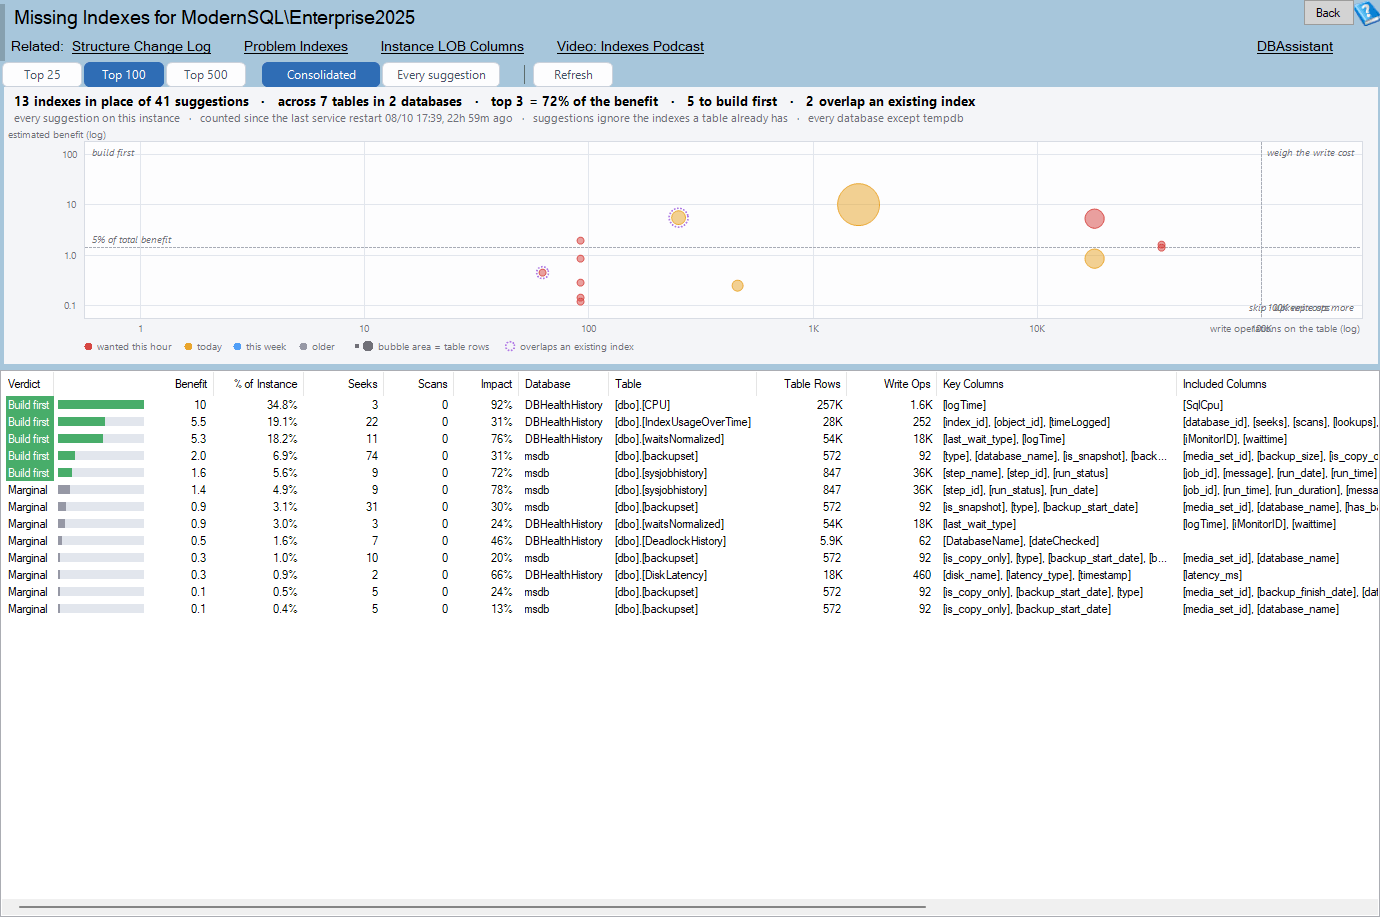
You can reach the plan from several places. The Indexing Overview footer links to it. The Missing Indexes toolbar has a Build consolidation plan button, and the Duplicate Indexes toolbar has Include in consolidation plan. The right-click Go to menu of any grid that lists tables offers the plan for that table, such as [dbo].[Orders], and All tables on the toolbar widens it again.
Guardrails
Some indexes are never dropped or altered. A row that would touch one is marked Blocked, with the reason shown. The blocked cases are:
- the clustered index, a primary key, a UNIQUE constraint, or a hypothetical index;
- the only index supporting a foreign key;
- an index named in an index hint in a procedure, function, view or trigger (the module text is searched, so this is reported as a possible reference);
- an index used by a forced Query Store plan;
- a key column that is a large object type, or a key over the 1,700 byte limit (900 bytes before SQL Server 2016). The text, ntext and image types cannot even be included.
A DROP is marked Review rather than Safe in several situations. One is when SQL Server has been up for less than the unused threshold, which is 30 days by default, and a banner tells you so. Another is when the unused index is barely written anyway. A third is when the duplicate rule says so, which happens with a unique copy or a copy that is read more than the keeper. An index with more included columns than the wide threshold is also marked Review.
When the login cannot read index usage, which needs VIEW SERVER STATE (or VIEW SERVER PERFORMANCE STATE on SQL Server 2022 and later), the plan still lists every index but offers no unused drops, and it says why. Sizes come from sys.partitions and sys.allocation_units.
The scripts
Script selected opens the forward script for the ticked rows. It is built in a fixed order.
- A preflight stops the script before anything is changed if any index the plan touches was dropped or changed since the plan was read. A checksum of the key and included columns, the filter and the uniqueness is compared. The preflight also stops the script if a new index name is already taken.
- CREATE statements come first. WIDEN and MERGE follow, written as CREATE INDEX with DROP_EXISTING = ON on the index that is kept, carrying every option it had. DROP statements come last, so nothing is removed before its replacement exists.
- A verification query lists the indexes of every table touched.
Every change is its own batch with a PRINT, and nothing wraps the batches in one transaction, because a large index build inside a single transaction holds the log until the end. If a batch fails, the script turns SET NOEXEC ON and skips the rest, so build the plan again before running it again. ONLINE = ON is added on Enterprise, Developer and Azure editions. Run the script in SSMS, or in sqlcmd with the -I switch.
Script rollback writes the inverse from the definitions captured when the plan was read. It re-creates every dropped index, restores every widened or merged index to its exact previous definition, and drops every index the plan created. Each step is guarded with IF EXISTS or IF NOT EXISTS, so a rollback can be run again safely. Save both writes <database>_index_plan.sql and <database>_index_plan_rollback.sql side by side. Save plan HTML saves the plan with each row’s reasoning, and Copy puts the plan on the clipboard as text.
Options
The defaults are: include suggestions with at least 5% of the database’s missing index benefit (the line the Missing Indexes chart draws), treat an index as unused after 30 days of uptime, allow at most 5 key columns in a planned index, call an index wide above 10 included columns, and warn when a table would carry more than 10 nonclustered indexes. Builds use MAXDOP 0, ONLINE = ON where the edition has it, SORT_IN_TEMPDB off, and the data compression of the table.
Measure widths samples the variable width columns that the planned indexes would carry, using AVG(DATALENGTH()), with TABLESAMPLE (1 PERCENT) on tables over 100,000 rows. The size estimates then use real widths instead of half the declared size.
How the estimates work
Sizes are estimates: the row count times the estimated width of the key and included columns, plus the row locator (the clustered key, or an 8 byte RID on a heap) and the row overhead, divided by the page fill. A widened index is scaled from its actual size today. Write rates come from sys.dm_db_index_operational_stats divided by the days since the restart. Those numbers and the missing index suggestions reset when SQL Server restarts, which is why the heading shows the uptime.
Service Broker report
The Service Broker report answers one question for the selected database: is Service Broker working, and if not, where are the messages stuck? Applications that use Service Broker, and the SQL Server features built on it (Database Mail, event notifications and query notifications), stop quietly when a queue is disabled or messages cannot be delivered. Nothing raises an error to the sender. The messages simply wait. Find the report under the database in the tree, at Real Time, then Service Broker.
What it reads
- whether the broker is enabled, from sys.databases.is_broker_enabled;
- every queue in sys.service_queues, with its services, depth and activation settings, and with VIEW SERVER STATE the queue monitor and the activation procedures running now;
- the transmission queue in sys.transmission_queue, grouped by target service and status;
- the conversation endpoints in sys.conversation_endpoints, counted by state and age;
- the instance’s Service Broker endpoint and any routes to other instances.
The top of the page has status cards: broker enabled or disabled, queues disabled out of all queues, messages in the queues, the transmission queue and the age of its oldest message, open conversations and how many are older than a day, activated tasks running, and the endpoint. A bar splits the conversation endpoints by state (CONVERSING, DISCONNECTED_INBOUND, CLOSED and so on). Click a card or the bar to open the grid view that lists what it counts. The findings sit underneath, most severe first and colored by severity.
Findings
| Finding | Severity | What it means |
|---|---|---|
| Queue disabled | Critical | RECEIVE or SEND is off on a queue. Poison message handling disables a queue after five rolled back RECEIVEs in a row, or someone ran ALTER QUEUE with STATUS = OFF. Messages pile up until it is turned back on. |
| Messages cannot be delivered | Critical | The transmission queue holds messages whose transmission_status reports an error such as no route, unknown service, or security and certificate errors. The status text is shown as SQL Server wrote it. |
| Messages waiting to be sent | Warning | Messages with no error that have waited more than 5 minutes. Check the route, the target broker and the endpoint. |
| Database Mail is stopped | Warning | In msdb, ExternalMailQueue is off because sysmail_stop_sp ran. Mail waits until sysmail_start_sp runs. |
| Service Broker disabled | Warning | The broker is off in a database that has user queues. This is common on a restored or attached copy. |
| Activation procedure missing | Warning | Activation names a procedure that does not exist, so nothing reads the queue. |
| Activation notified but no reader running | Warning | The queue monitor started activation but no activated task is reading, so the procedure is probably failing. |
| Queue backlog | Warning | 10,000 or more messages in one queue. |
| Leaked conversations | Warning | More than 10,000 open conversations began more than a day ago. Conversations that are never ended grow the database and tempdb. |
| Ended by the other side but not here | Info, or Warning at 1,000 or more | DISCONNECTED_INBOUND endpoints: the far side called END CONVERSATION and this side never did. |
| Conversations in the ERROR state | Warning | An error ended the conversation, and the endpoint stays until this side ends it. |
| Remote routes but no started endpoint | Warning | A route points to another instance but the Service Broker endpoint is missing or stopped. |
A finding whose name ends in “could not be read” has the severity Unknown. It means a part of the read was refused, because the queue monitors and activated tasks need VIEW SERVER STATE.
Views and fix scripts
The toolbar switches the grid between four views: Findings, Queues (state, services, depth, activation, readers, monitor state and poison message handling, with a disabled queue in red), Transmission Queue (messages grouped by target service and transmission status, with the count and the oldest) and Conversations (endpoints by state, how many began more than a day ago, and how many have an unknown age).
Double click a finding, a disabled queue or a conversation state, or right-click and choose Script, to see the fix script. Scripts are shown and never run. They cover four cases.
- ALTER QUEUE with STATUS = ON, together with the query to look at the message that kept failing first. Without that look, poison message handling disables the queue again.
- EXEC msdb.dbo.sysmail_start_sp for a stopped Database Mail.
- ALTER DATABASE with SET ENABLE_BROKER, and NEW_BROKER for a copy.
- An END CONVERSATION … WITH CLEANUP template, in batches of 10,000, with a warning that CLEANUP removes the conversation and its messages without telling the other side.
How it is measured
Queue depth comes from the row count of each queue’s internal table in sys.partitions, not from COUNT(*) on the queue, so a queue with millions of messages costs nothing to measure. A conversation endpoint has no creation date, so its age is derived from its expiry: a dialog begun with the default lifetime expires 2,147,483,647 seconds after it began. A dialog begun with a shorter LIFETIME is counted under Unknown Age.
Every part of the read runs inside TRY/CATCH, so a login without VIEW SERVER STATE still gets the queues, the transmission queue and the conversations, and the page lists what it could not read. Azure SQL Database has no Service Broker, and the page says so. Error Log holds activation procedure failures and poison message events, and Waits shows the BROKER_ waits.
Service Broker by Database
Service Broker by Database is the instance view of the same page. It answers which databases on this instance have a disabled queue, undelivered messages or a pile of conversations that were never ended. Each database is read with the same query and the same rules as the database page, so the counts and findings agree on both.
A database is listed when its broker is enabled or when it holds something: a user queue, a message waiting to be sent, or a conversation. Databases with the broker disabled and no queues are left out, and the title says how many of the instance’s databases are listed.
The columns are Database, Status (red when a finding is critical), Broker, User Queues, Disabled Queues (red when any), Queued Messages, Transmission Queue, Oldest Unsent, Open Conversations (every state but CLOSED), Older Than 1 Day and Activated Tasks, which shows “n/a” without VIEW SERVER STATE.
The databases are read one after another with a progress line and a Cancel button. A database that is offline or that the login cannot open is listed with the reason when its broker is enabled. Double click a row, or right-click and choose Open Service Broker, to open that database’s page with the queues, the transmission queue, the conversations and the fix scripts.
Data Protection report
The Data Protection report answers one question for one database: the columns that hold sensitive data, what is actually protecting them? The Sensitive Data report finds columns that look like personal or payment data, and TDE Status covers encryption at rest. This page shows the protections applied to the columns themselves. It covers:
- Always Encrypted columns, their column encryption keys, and the column master key with its key store and path;
- dynamic data masking, with every masked column, its masking function, and who can read it unmasked;
- row-level security policies, whether each is on, and their filter and block predicates;
- sensitivity classifications stored in the database (native from SQL Server 2019, and the extended properties SSMS wrote on older versions);
- ledger tables (SQL Server 2022).
Only metadata is read. The page never reads an encrypted or masked value.
Which columns count as sensitive
A column is sensitive when it is classified in the database, when it is encrypted with Always Encrypted or masked (because someone already decided it needed protection), or when its name matches a Sensitive Data rule. The name match uses the types switched on and the custom patterns in Sensitive Data Options. Each sensitive column is counted once, under its strongest protection.
| Protection | Meaning |
|---|---|
| Encrypted | Always Encrypted. The server never sees the plain value. |
| Masked | Dynamic data masking. Users without UNMASK see a masked value. |
| Classified only | Labeled with a sensitivity classification, but not encrypted or masked. |
| Unprotected | Looks sensitive and is neither encrypted, masked nor classified. |
The cards across the top count the sensitive columns and each protection, the row-level security policies and how many are off, the column master keys and how many live in a Windows certificate store, and the ledger tables. A bar under them splits the sensitive columns by protection. Click a segment or a coverage card to list just those columns in the Sensitive Columns view.
Findings
| Finding | When |
|---|---|
| Sensitive column with no protection | A table has sensitive columns that are neither encrypted, masked nor classified. There is one finding per table, naming the columns. |
| RLS policy disabled | A security policy exists but is STATE = OFF, so it filters and blocks nothing. |
| Masked column readable because users have UNMASK | An explicit UNMASK grant (database, schema, table or column level) lets a user or role read masked columns in the clear. There is one finding per grantee. |
| Column master key in a Windows certificate store only | The key is a certificate in a Windows certificate store. Every client needs a copy, and losing the certificate loses the data. |
Information lines also note members of db_owner, who always read masked data unmasked, and ledger tables with no automatic digest storage. A part of the read that the login is refused is listed with what the server said.
Views, versions and scripts
The page has seven views: Findings, Sensitive Columns (unprotected columns first), Always Encrypted (encrypted columns, then the column master keys with key store, key path and enclave setting), Masked, Row-Level Security (each policy and predicate), Classifications and Ledger.
| Feature | Needs |
|---|---|
| Always Encrypted, dynamic data masking, row-level security | SQL Server 2016 |
| Native sensitivity classifications (sys.sensitivity_classifications) | SQL Server 2019 |
| Ledger tables | SQL Server 2022 |
| UNMASK at schema, table or column level | SQL Server 2022 |
A view whose feature is newer than the instance says “Not available on this version”. On SQL Server 2014 and older the page shows only that message and the Sensitive Data button.
Right-click scripts are shown and never run. Script Mask writes an ALTER TABLE with ADD MASKED WITH for a sensitive column that is not masked or encrypted. Script Enable writes ALTER SECURITY POLICY with STATE = ON for a disabled policy. Script Revoke UNMASK writes the matching REVOKE for a grant.
The page reads catalog views only. Without VIEW DEFINITION a login sees only the objects it has permission on, so the counts may be low, and the page says so. The UNMASK and db_owner information comes from sys.database_permissions and sys.database_role_members.
Data Protection by Database
Data Protection by Database is the instance view of the Data Protection page. It answers which databases on this instance hold sensitive columns with no protection, and which use Always Encrypted, masking, row-level security or ledger. Each user database is read with the same query and rules as the database page, so the counts and warnings agree.
The columns are Database, Status, Sensitive, Unprotected (sensitive columns that are neither encrypted, masked nor classified), Classified Only, Masked, Encrypted, RLS Policies and RLS Off, Master Keys, UNMASK Grants and Ledger Tables.
A value of “n/a” means the feature is newer than the instance. The databases are read one after another with a progress line and a Cancel button, and a database that is offline or that the login cannot open is listed with the reason. Double click a row, or right-click and choose Open Data Protection, to open that database’s page.
Analysis Services report
SQL Server Analysis Services (SSAS) problems such as processing failures, memory limit breaches and long running DAX or MDX queries do not show up in anything SQL Server itself reports. The Analysis Services instance report connects to the SSAS instance and shows its mode (Tabular or Multidimensional), version and edition. It also shows memory used against the Low, Total and Hard limits, the sessions and the commands running now, memory by object as a treemap, processing freshness, the databases, and the server properties that differ from their defaults. Every call the report makes is a read. It never processes, cancels or changes anything on the SSAS instance.
To open it, right-click the server, choose Instance Level Reports, then Analysis Services. It also appears in the Configuration group of the instance reports navigator.
Which SSAS instance is read
By default the report looks for SSAS on the same host with the same instance name as the SQL Server, which is what setup gives them when they are installed together. A SQL Server named HOST\SALES is paired with SSAS at HOST\SALES. When SSAS runs somewhere else, click Set SSAS Server on the toolbar and enter its name as SERVER, SERVER\INSTANCE or SERVER:port. Entering AUTO goes back to looking beside the SQL Server. If no SSAS instance answers, the page says which name it tried and why it failed. A SQL Server with no Analysis Services beside it needs nothing here.
The views
The memory bar is filled to the memory SSAS is using. It is green below the Low limit, amber above it and red above the Total limit, with the Low, Total and Hard limits marked. The memory used and the limits come from the SSAS performance counters on its host, for example MSOLAP$INSTANCE:Memory. When those cannot be read, the limits come from the server properties instead. A value of 100 or less is a percentage of the host’s physical memory, which is taken from the SQL Server when SSAS is on the same host.
- Sessions and Commands lists every session, running commands first and longest first, and marks a command running for more than a minute in red. Right-click a row to copy the command text or the XMLA Cancel script for that session, to run in SQL Server Management Studio if you decide to.
- Memory by Object shows each database and object as a tile sized by the memory it holds, from DISCOVER_OBJECT_MEMORY_USAGE.
- Processing Freshness lists every Tabular partition, or every Multidimensional cube, with its last processed time, age and state. Failed (an error), Never and Stale (older than the threshold of 1, 7 or 30 days) rows sort to the top. DirectQuery partitions hold no data and are never stale.
- Databases has one row per database with model type, compatibility level, memory, tables, partitions, roles and the counts of stale and failed partitions.
- Server Configuration lists the properties that differ from their defaults, and marks a property changed but waiting for a restart in its Pending column.
Permissions and setup
The report connects to SSAS with ADOMD.NET as your Windows user. Most of the DMVs it reads need Analysis Services server administrator, and a read that is refused is listed on the page while the rest of the report still shows. Counters on a remote host need your account in that host’s Performance Monitor Users group. From the SQL Server it reads SERVERPROPERTY(‘MachineName’), SERVERPROPERTY(‘InstanceName’) and the physical memory from sys.dm_os_sys_info, which needs VIEW SERVER STATE. Without that permission, only the percentage limits cannot be resolved. Azure SQL and SQL Server on Linux have no Analysis Services beside them, so use Set SSAS Server to name one to read.
The rest of the new features
Web dashboard in the monitoring service
The monitoring service can serve a read-only web dashboard. It is off by default, and it listens on localhost only until an administrator changes that on the new Web Dashboard tab of the tray application. The tab holds the host name, port, HTTPS and certificate settings and the Viewer and Admin groups.
The estate overview shows the worst servers first, with cards for CPU (with a sparkline), active alerts, blocking, deadlocks in the last 24 hours, lowest disk free and the last collection. Each server has its own page with 24 hour CPU, page life expectancy and batch requests charts, plus disk, active alerts, blocking and deadlocks. Separate pages list alerts, deadlocks and blocking, and the same data is available as JSON. Server status is decided by one set of rules: Error, Critical, Stale, Warning and OK.
Access uses Windows authentication only, with Viewer and Admin Windows groups. Admin implies Viewer, an Admin only status page exists, and the 403 page names the account that signed in. The host accepts GET and HEAD requests only, limits concurrency and applies a per-account rate limit. It writes an hourly sign-in audit to the service history, sends security headers, HTML encodes every value and returns no connection strings. HTTP is refused on anything except localhost, so for any other address you configure HTTPS with a certificate from LocalMachine\My, and the service reports clear errors for a missing, keyless or expired certificate. A 30 second shared cache means each history database is read once per page however many people are viewing.
Offer to trust an untrusted server certificate
When a saved connection is refused because the server certificate is not trusted, the application now asks once per session whether to trust it. A yes saves the change the same way Edit Connection does, adds TrustServerCertificate=True while keeping your Encrypt choice, rebuilds the tree, reconnects and opens the Server Overview. Before this, the instance only showed Disconnected with the raw driver message. The question is never asked in unattended modes.
Clear message for a missing SqlClient native DLL
Microsoft.Data.SqlClient on .NET Framework opens every connection through its SNI native DLL (Microsoft.Data.SqlClient.SNI.x64.dll on 64 bit processors). There is no managed fallback. When that file was missing or blocked, every saved instance failed in the TdsParser initializer and filed its own crash report without telling you why. The main application, the service, the tray and the other executables now check for the file at startup, and the message names the file, the folder, whether it is missing or cannot be loaded, and that the fix is to repair with the installer.
Faster history collection and a more forgiving upgrade
The procedures that collect table growth, chargeback usage, file size, index usage and deadlock history were tuned to run faster. The upgrade of the DBHealthHistory database is also more forgiving. Alert steps now run correctly when the login is a db_owner but not dbo, because the step switches to the dbo user for the two tables that need it and reverts afterward. On Amazon RDS, where nobody is sysadmin, the upgrade now stops once, instead of failing on every report that asks for history, when the login is not the master user. When the history version cannot be read, the message says why instead of ending with a blank version.
Merge replication resolver health check
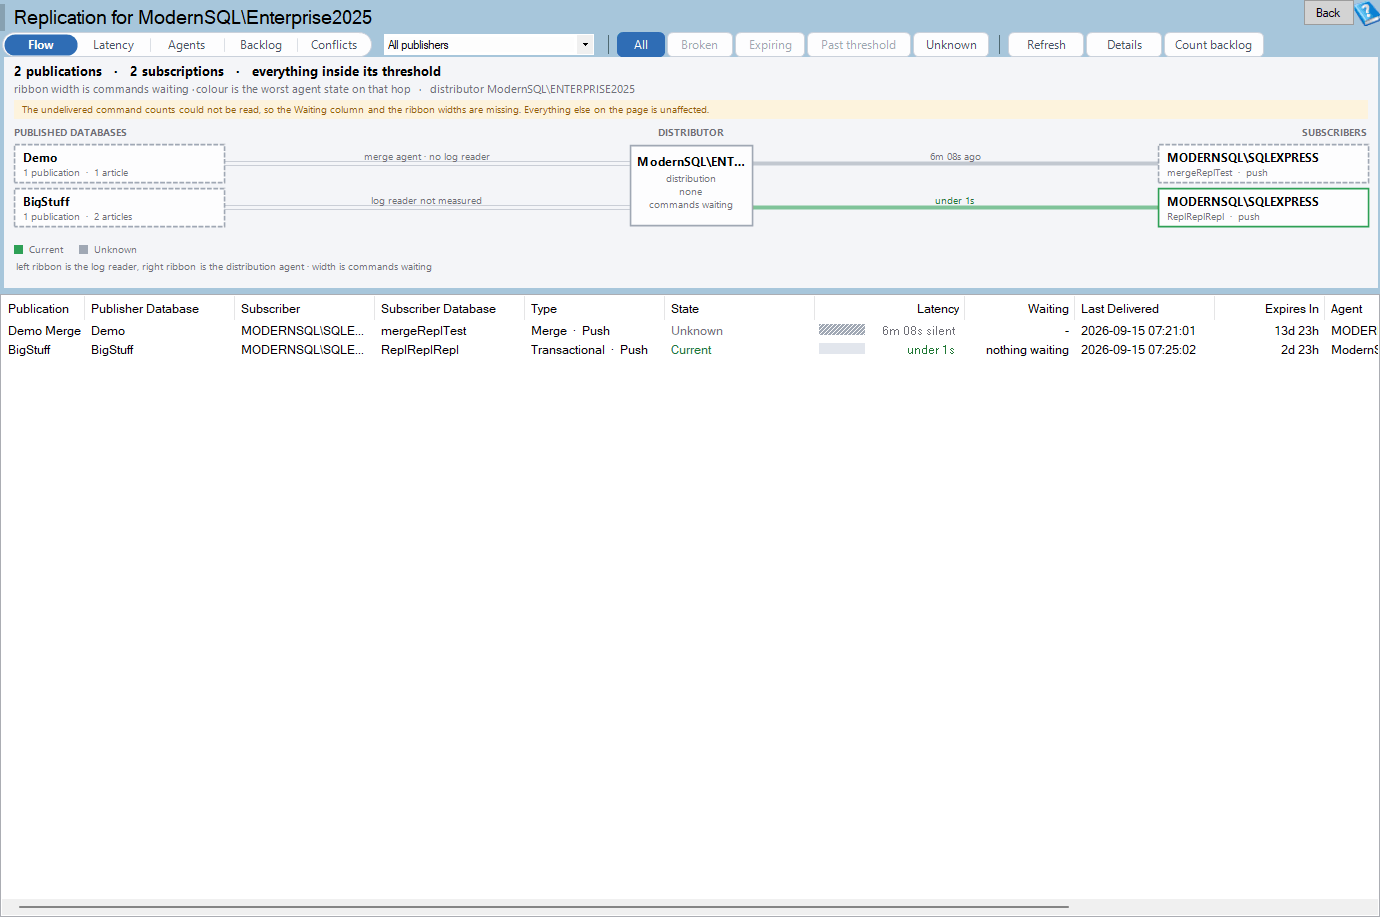
Merge replication articles can resolve conflicts with a custom stored procedure, and the Stored Procedure Resolver requires the procedure to return a result set whose row identifier matches the row identifier passed in. When it does not, the same row is retried on every sync and the merge agent keeps failing. The new health check reads the merge published databases for the articles and procedures, and the local distribution databases for the error history. Procedure definition checks are pattern based, so they flag risky code rather than proving a procedure is broken, and the error history is the definitive signal that the problem is happening now. The check writes nothing. The workaround and restore statements it generates are text for you to read and run. The replication instance report was reorganized in the same release.
Quick Scan zoom
In the Quick Scan detail pane, Ctrl and the mouse wheel now enlarge or shrink the description and the affected objects list together. The step is one point per notch, the size is limited to 6 through 25 points, and it is kept for the session, so reopening the pane or selecting another finding keeps the size you chose.
Azure SQL Health Monitor Try Again and F5
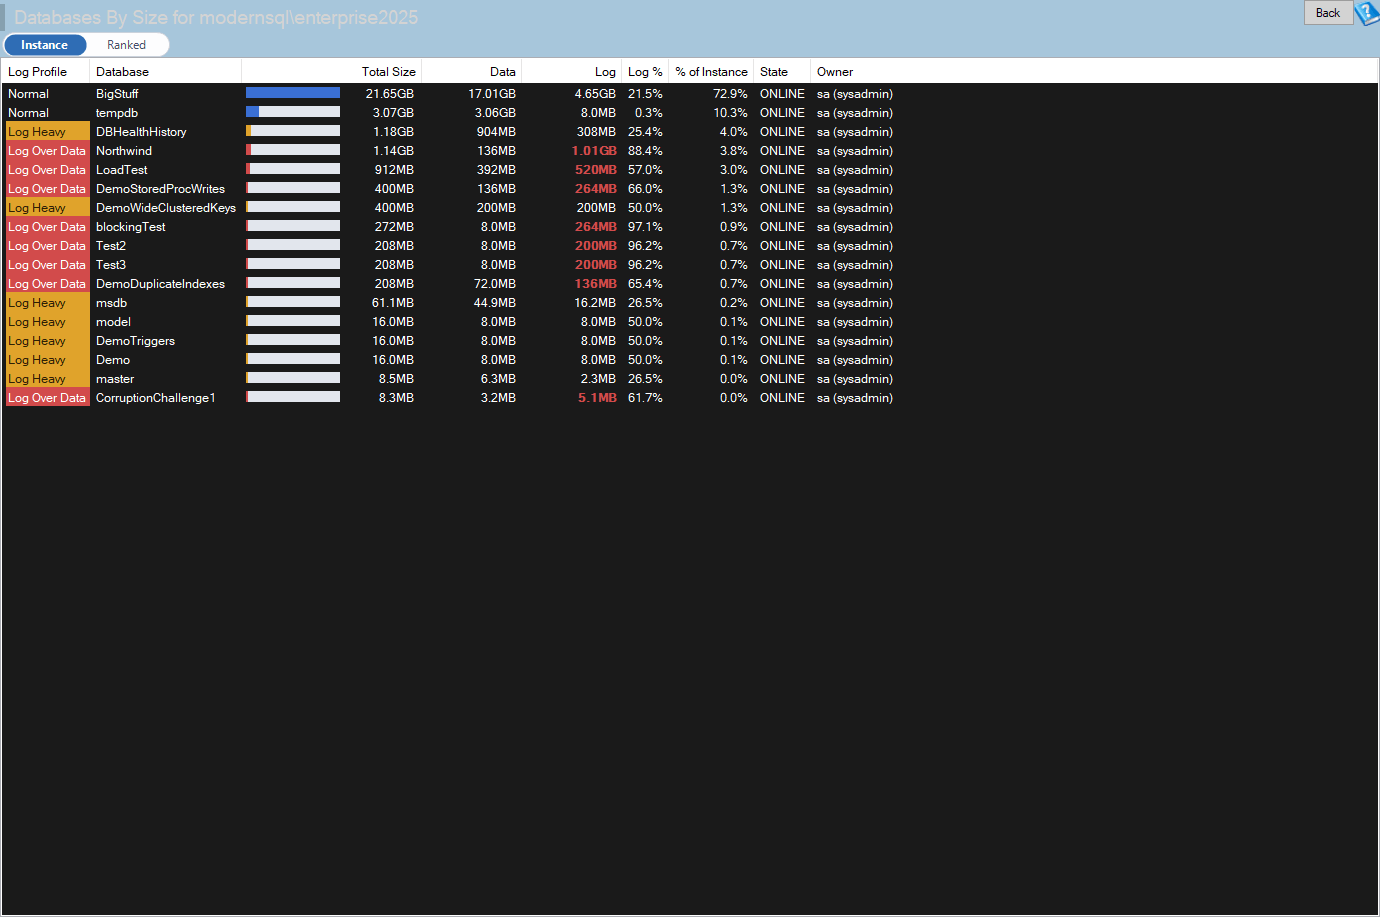
Azure SQL Health Monitor now offers Try Again and F5 after a report fails to open.
Bug fixes
This release fixes 278 tickets, including 9 crashes and 30 fixes in Azure SQL Health Monitor. Most of the rest are wrong or misleading results, reports that stayed blank or claimed success after a query timeout, leaked connections, and grids that did not fit the window at 1280×900. Several fixes were part of overall performance work that also reduces CPU use on the DBHealthHistory database.
Putting the release to use
Start with the Index Consolidation Plan on the database whose indexes you trust least, review the Review and Blocked rows first, and save both scripts. Then open Service Broker by Database and Data Protection by Database to see whether any database needs the detailed page, and use Set SSAS Server if your Analysis Services runs on another host. If you want health information without opening the application, enable the web dashboard on its tray tab and restrict access with the Viewer and Admin groups.
Try Database Health Monitor 4.1626
The Index Consolidation Plan, the Service Broker, Data Protection and Analysis Services reports, and the new web dashboard are all in this release. They only read from your servers and never change anything on their own, so you can point them at a real instance and see what they find.
Download Database Health Monitor and run it against your own server. There is nothing to configure first.