Pending RECONFIGURE: Find Settings That Never Took Effect
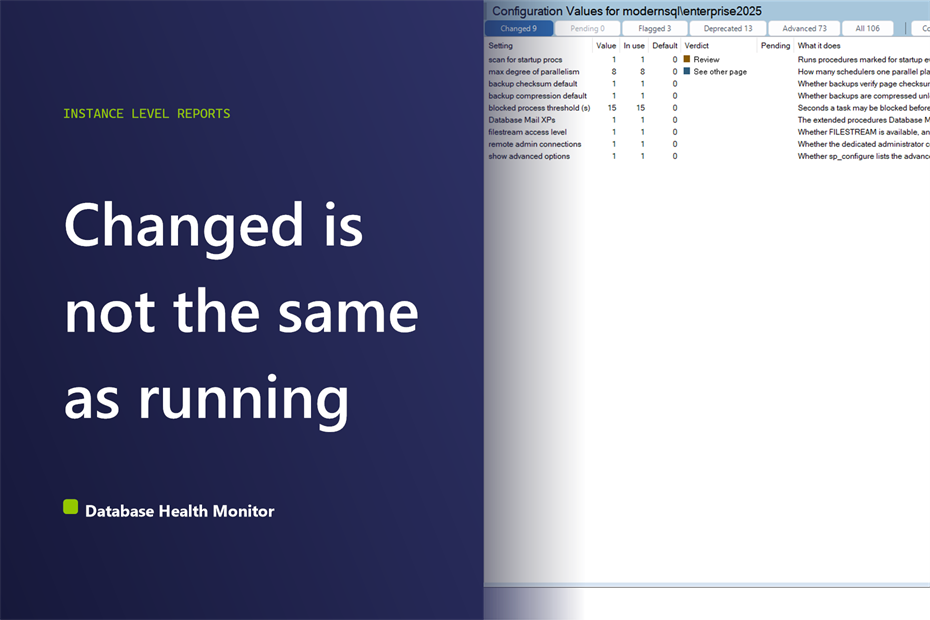
You ran sp_configure last Tuesday, the output said the option had changed, and the server is still behaving exactly as it did before. Nobody lied to you. The setting simply never took effect, and a pending RECONFIGURE is the quietest way that happens. It can sit unnoticed for months.
How do I find a pending RECONFIGURE in SQL Server? Compare the configured value with the value in use for every setting in sys.configurations. Where they differ, the change has not taken effect: either a RECONFIGURE was never run, or the setting is not dynamic and waits for a service restart. Any row that disagrees with itself is a pending RECONFIGURE or a queued restart.
Database Health Monitor has a page built for this, called Configuration Values. It reads sys.configurations and sets what is configured beside what the engine is actually running. It also carries the default each setting ships with, which the catalog view never does.
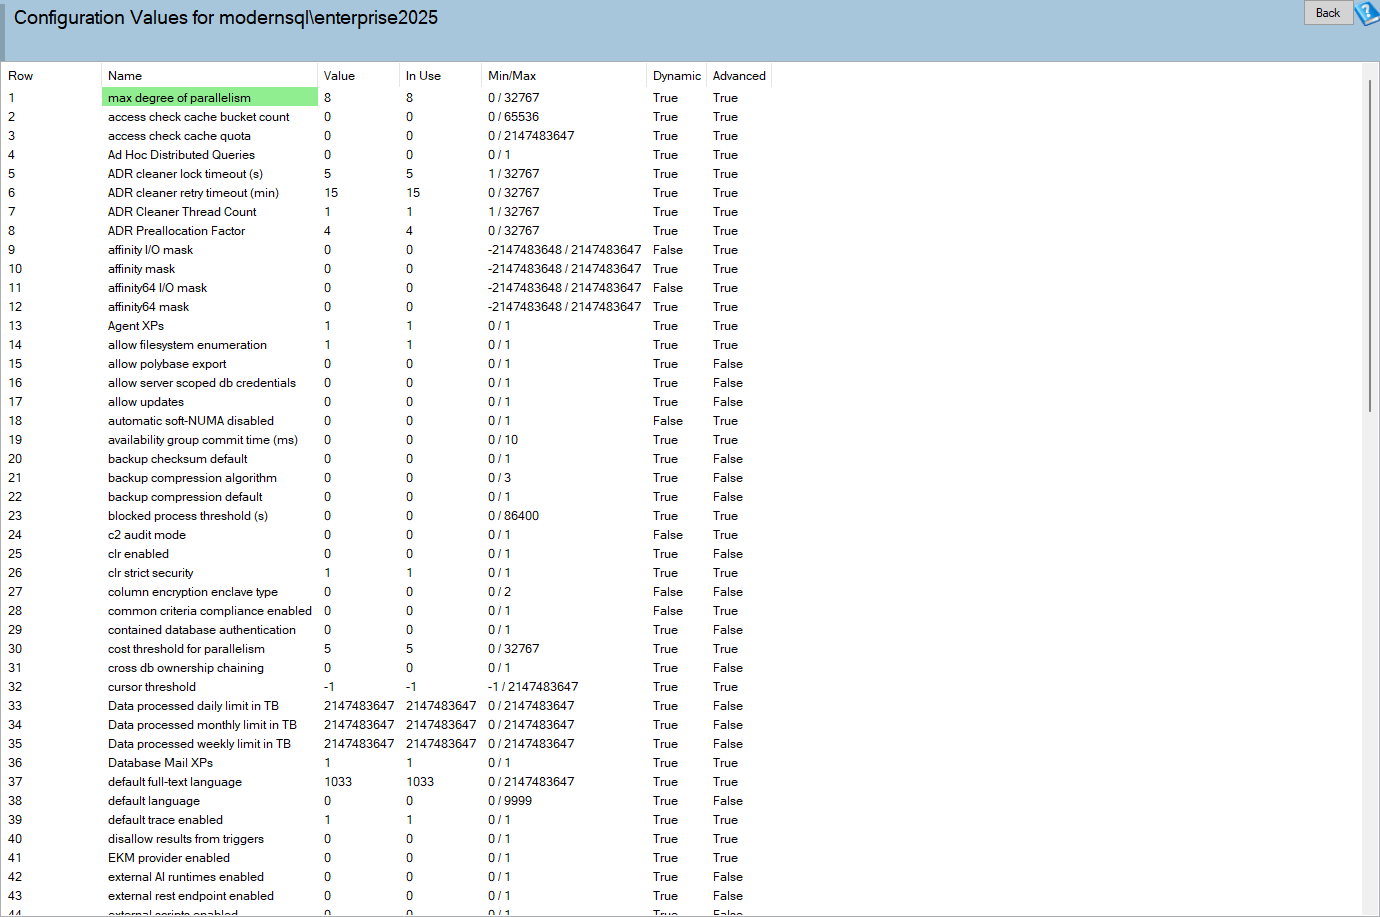
Configuration Values is one of the reports in Database Health Monitor. It runs against your own servers, and it takes about a minute to have this same screen open on one of them.
Why the sp_configure output fools you
The usual move is to run sp_configure again and look at the number you typed. It is there. That proves the value was stored. It proves nothing about whether the instance is using it.
Two numbers exist for every setting. One is what somebody asked for. The other is what the engine has. Until a RECONFIGURE runs, or until a restart for the settings that cannot change live, those two can disagree for as long as you like.
There is a second trap. sp_configure hides the advanced options until show advanced options is on, so the list you scrolled may not have been the whole list. The page reads sys.configurations directly, which has no such distinction, so nothing is hidden from you.
Spotting a pending RECONFIGURE in the grid
The grid has three columns that matter here. Value is what is configured. In use is what the instance runs with. Default is what this build ships. When the first two disagree, the change is not in force. When the first and third disagree, somebody set it on purpose.
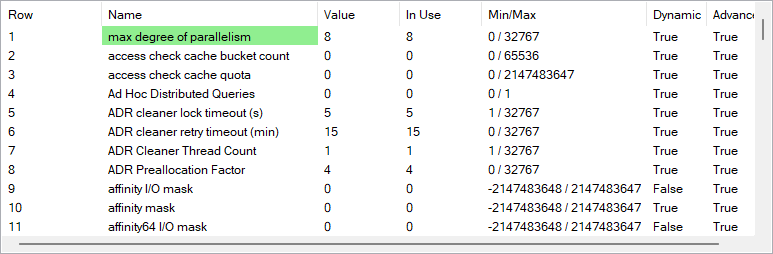
The Pending column then says why, in words, so you do not have to work it out from the numbers.
| Pending reads | What happened |
|---|---|
| Needs a RECONFIGURE | Someone ran sp_configure and stopped there. One more statement brings the setting into force. |
| Needs a restart | The setting is not dynamic, so the new value waits for the next service start. |
| Not in force, see details | Neither explanation covers it. Double-click the row for the full picture. |
Two rows are left out on purpose. min server memory (MB) reads 0 configured and 16 in use on every instance, because 16 is the engine's own floor. And filestream access level is marked dynamic yet also needs the FILESTREAM switch in SQL Server Configuration Manager, so it gets a caveat instead of a wrong instruction. Without those two exclusions every server in your estate would show a pending change, and you would learn to ignore the column.
The non-dynamic case deserves a second look. If the box restarts unexpectedly, it comes back configured differently from how it went down. Better to know that on a quiet afternoon.
Start from what somebody changed
SQL Server 2022 exposes 97 settings. On most instances only five or six have ever been touched, and the page opens on exactly those. The Changed button compares the configured value to the shipped default, not to the running one, so a value the engine picked for itself is not blamed on a person.
Three things are filtered out. Agent XPs is switched on by SQL Server Agent at service start. The two version settings describe the build and hold no choice, so their Default reads a dash. And the two accelerated database recovery cleaner settings, which ship as 0 on SQL Server 2019 and as 15 and 4 on SQL Server 2022, are skipped when the build cannot be read.
On a server you have never seen, this list is the whole record of what somebody decided. It is short enough to read in seconds. The buttons beside it, Pending, Flagged, Deprecated, Advanced and All, each carry their own count.
The verdicts, and why MAXDOP stays quiet
Only settings with an answer that holds on nearly every instance get a verdict. Most rows have none. That restraint is the point, because a wrong color is worse than no color.
- Act is wrong almost everywhere and the fix is known:
max server memory (MB)left at 2147483647,fill factor (%)set between 1 and 84, andpriority boost,lightweight pooling,set working set sizeorallow updatesset to 1. - Review is defensible if someone can say why. That covers
xp_cmdshell,clr enabled,optimize for ad hoc workloads,max worker threads, hand pinned affinity masks and similar. - See other page is the verdict that is not a verdict.
Fill factor gets a band rather than a single line. 0 and 100 both mean fill the page, and 85 to 99 is a defensible choice. Only 1 to 84 across the whole instance is flagged. If that setting worries you, our post on SQL Server Disabled Index: Why Your Query Ignores It covers another place fill factor shows up.
max degree of parallelism and cost threshold for parallelism are marked See other page and given no opinion. The right MAXDOP depends on core count, NUMA layout and the parallel waits the instance records, and Parallelism Calibration works all three out. An older version of this report used a fixed green band from 1 to 8. It called 8 correct on a four core box and a considered 12 wrong on a two socket machine.
MAXDOP at 0 with the cost threshold at 5 is the untouched default pair. On an instance with more than a handful of cores, that is where CXPACKET and CXCONSUMER waits tend to come from.
Reading it without changing anything
The page only reads. It needs no VIEW SERVER STATE, because sys.configurations asks for no special permission, which is why it works on instances where most pages do not. Nothing is stored.
Scripts are written but never run. Copy review script puts the pending items, flagged items and changed items on the clipboard as one commented script, along with the query behind the page, so you can check the report instead of trusting it. Right-click a row for that setting's statements. If the setting is advanced, the show advanced options step is included, since that is the one people forget. If it is not dynamic, the script says so, because a RECONFIGURE on those records the change and leaves the old value running.
Finish with Deprecated on any instance that has been upgraded a few times. Settings outlive their usefulness by years. The full column reference lives in the Configuration Values documentation.
What to check on your own server
- Open the Changed list on each instance and read every setting somebody moved away from the shipped default
- Check the Pending column for any row that needs a RECONFIGURE or a restart
- Compare Value and In use on every non-dynamic setting before you plan an unplanned restart
- Review max server memory (MB) wherever it still reads 2147483647 and anything else shares the machine
- Look through Deprecated on any instance that has been upgraded a few times
Try Database Health Monitor Today
Configuration Values shows every setting somebody changed, every change that never took effect, and the default each one ships with, in one grid. Database Health Monitor shows it on every instance you connect, in the time it takes to open the report.
Download Database Health Monitor and run the Configuration Values report against your own server. There is nothing to configure first, and you will know inside a few minutes whether it tells you something you did not already know.