SQL Server Seek vs Scan: Why a Flat Read Count Lies
A query that used to be fast is now slow, and the index behind it shows the same number of reads it always did. Nobody touched the code. Nothing looks wrong on the usual usage chart. This is a SQL Server seek vs scan problem, and a total of reads cannot show it, because the total never changes while the way the index is read does.
How do I tell whether a SQL Server index is drifting from seeks to scans? A SQL Server seek vs scan problem hides inside a flat read count, because a seek and a scan each add one read. Track seek share, which is seeks as a percentage of reads per day, and watch for a fall of 15 percentage points or more between the first and second half of the window.
Database Health Monitor catches this with the Index Scan Drift report, which watches the ratio instead of the total. Most people start somewhere else, so start there too.
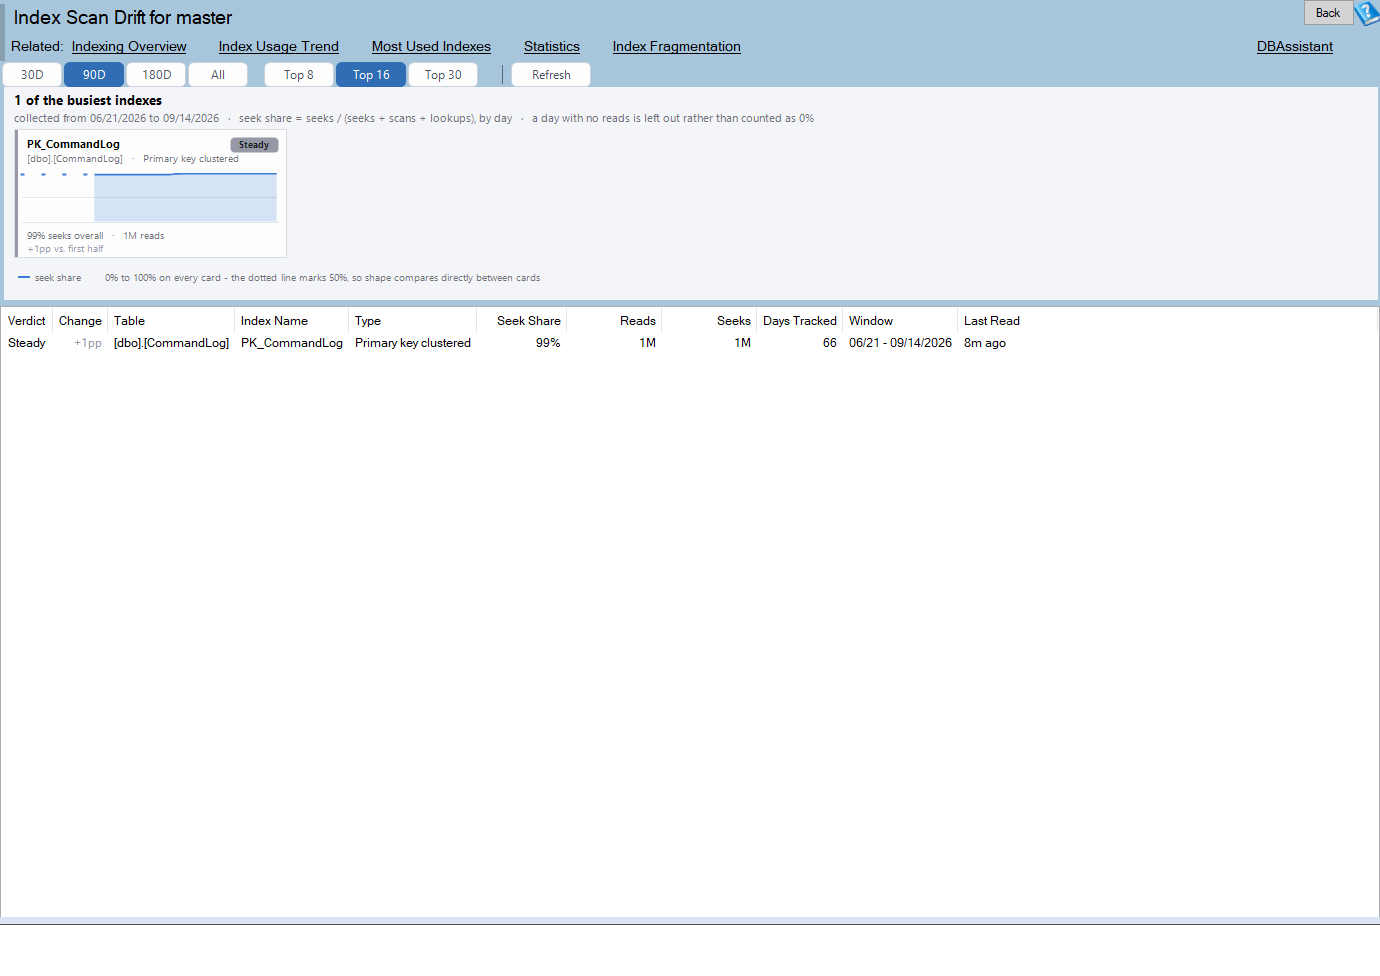
Index Scan Drift is one of the reports in Database Health Monitor. It runs against your own servers, and it takes about a minute to have this same screen open on one of them.
SQL Server seek vs scan: what the read count hides
The usual first move is a read trend. Reads per day, per index, over a few months. It is a good chart for finding an index nobody uses, or one whose traffic is falling. It is a poor chart for this problem, because a read is a read. A seek adds one. A full scan adds one.
So an index can go from nearly all seeks to nearly all scans while its line stays flat the whole way. A stale statistic can do it. So can a predicate that stopped matching the leading key, or a schema change upstream. Each pushes the optimizer toward a worse access path. None of them changes how often the index is touched.
Measure the seek share instead
Seek share is seeks as a percentage of reads, worked out for each day. Because it is a percentage, every index can sit on one shared axis. A steady 40% index and one collapsing from 90% to 20% are told apart by shape, not by height. Scaling each card to its own peak would flatten the exact comparison you want.
The numbers come from the IndexUsageOverTime history that Most Used Indexes and Index Usage Trend already read. Nothing extra is collected. The report is historic only, so the historic collection database has to be configured, and the page tells you when it is not.
Two details keep the line honest. A day with zero reads is left out, not plotted as 0% seeks, because silence is a different fact from no seeks. And a verdict needs a move of 15 percentage points, second half of the window against the first, which screens out ordinary wobble. The same habit of separating noise from change is behind Is a SQL Server Query Regression Statistically Significant?.
What the cards and the grid tell you
Each index gets one of four verdicts.
| Verdict | What it means |
|---|---|
| Drifting to Scans | Seek share fell 15 points or more, second half against first |
| Drifting to Seeks | Seek share rose 15 points or more, often a fix that already landed |
| Steady | Neither half moved enough to call a trend |
| Not enough history | Too few reads, or too few days with a read |
Indexes are ranked by total reads, not by how far they drifted. The busiest indexes cost you the most when they slip, so they come first. Pick 30D, 90D, 180D or All for the window, and Top 8, 16 or 30 for how many cards you want.
The grid carries the same story as numbers: Change, Seek Share, the Reads and Seeks behind it, and Days Tracked, which tells you how much history the verdict rests on.
What to do with a Drifting to Scans card
- Start with the table's last statistics update. A stale auto-updated statistic is the most common cause.
- If statistics are current, look at the queries. A range that used to be selective and no longer is will do it.
- Treat Drifting to Seeks as good news worth confirming. A statistics update, a rebuild or a query fix probably landed.
- Double click the card to open Index Fragmentation on that index, since fragmentation is a separate way a seek gets slower.
Timing helps. A drift that appears right after a maintenance window sends you to the question of whether statistics were meant to update in it and did not. A busy write index is another suspect, because heavy writes can outrun the auto-update threshold between refreshes.
A Steady card at a low seek share is not a drift, but it deserves a look anyway. An index that rarely seeks may never have had the right key order for how it is queried.
The two views also answer different questions. Declining reads on Index Usage Trend with a steady seek share is a volume change. A steady read count with a drifting seek share is a shape change, and that one needs a different fix. The full reference for every column and button is on the Index Scan Drift help page.
What to check on your own server
- Open the history for your busiest indexes and compare seeks against total reads, not reads alone
- Check the last statistics update on the table behind any index whose seek share has fallen
- Look at whether a query predicate changed shape, such as a range that used to be selective
- Rule out fragmentation on the index once statistics and predicates look clean
Try Database Health Monitor Today
Index Scan Drift shows which indexes are quietly sliding from seeks to scans, before the queries they serve start to slow down. Database Health Monitor shows it on every instance you connect, in the time it takes to open the report.
Download Database Health Monitor and run the Index Scan Drift report against your own server. There is nothing to configure first, and you will know inside a few minutes whether it tells you something you did not already know.