Database Health Monitor 4.1625: 29 New Reports, 12 New Alerts and a Redesigned Performance Dashboard

Database Health Monitor 4.1625 adds 29 new reports, 12 new built-in alerts plus alerts you write yourself in T-SQL, a rebuilt performance dashboard and 934 bug fixes. This post walks through every one of the new reports: what it reads, what it flags, and the thresholds it uses, so you can decide whether it covers the problems you deal with.
Several of the new reports are backed by new history collections in DBHealthHistory, so they show trends over days and months instead of only the current moment. Where a report needs that history, it is called out below.
The release at a glance
- 10 new database pages: CDC and Change Tracking, Data Compression, Full-Text Search, In-Memory OLTP, Module Execution Statistics, Plan Guides and Hints, Sensitive Data, Table Growth History, Temporal Tables, and Version Store and ADR.
- 17 new instance reports: Availability SLA, Chargeback, Connections Over Time, Failover Cluster, Host and Hardware, In-Memory OLTP by Database, Key Exhaustion by Database, Latches and Spinlocks, License and Edition Footprint, Memory Pressure, Module Execution Statistics by Database, Permissions Matrix, Sensitive Data by Database, Session Waits, Version Store and ADR by Database, Windows Event Log, and Workload by Application.
- A Consolidation Planner on the Tools menu, and a Security Posture report in Azure SQL Health Monitor.
- 30 new features, led by twelve built-in alerts, custom T-SQL alerts, new history collections, Save as Excel and a calmer way of handling errors.
- 934 bug fixes, including 48 crashes and 42 fixes in Azure SQL Health Monitor.
Performance, waits and workload
These seven reports take you past “the server is slow” to the structure, the session, the application or the piece of code responsible.
Latches and Spinlocks
The Waits report can tell you that queries are waiting on LATCH_EX or LATCH_SH, but that only says “an internal structure.” The fix depends on which structure it is. ACCESS_METHODS_DATASET_PARENT points at parallel scans, FGCB_ADD_REMOVE at data file growth, LOG_MANAGER at log growth. Latches and Spinlocks reads sys.dm_os_latch_stats and sys.dm_os_spinlock_stats and names the class and the fix.
You choose the window. Since startup shows rates per hour of uptime. Sample reads both views, waits 10, 30 or 60 seconds, reads again and shows only the difference. If SQL Server restarted or the counters were cleared during the sample, the page says the sample could not be used instead of drawing negative numbers.
A latch class is flagged Notable when it has more than 100 ms of waiting per second measured, or more than 10 ms per wait on average. BUFFER is never flagged and is left out of the chart, because it counts every PAGELATCH_* and PAGEIOLATCH_* wait and would flatten every other bar. Two bar charts show the top 15 latch classes by wait time and the top 15 spinlocks by spins, with backoffs drawn under each.
Pick a row and a knowledge pane explains what the class protects and what usually fixes it, with buttons that open the report behind it, such as Parallelism Calibration for ACCESS_METHODS_DATASET_PARENT or File Utilization for FGCB_ADD_REMOVE. For spinlocks the pane is honest: spins alone are normal, and a spinlock matters when its backoffs climb with its spins and CPU is high without a query to explain it. You need VIEW SERVER STATE (VIEW SERVER PERFORMANCE STATE on SQL Server 2022 and later).
Session Waits
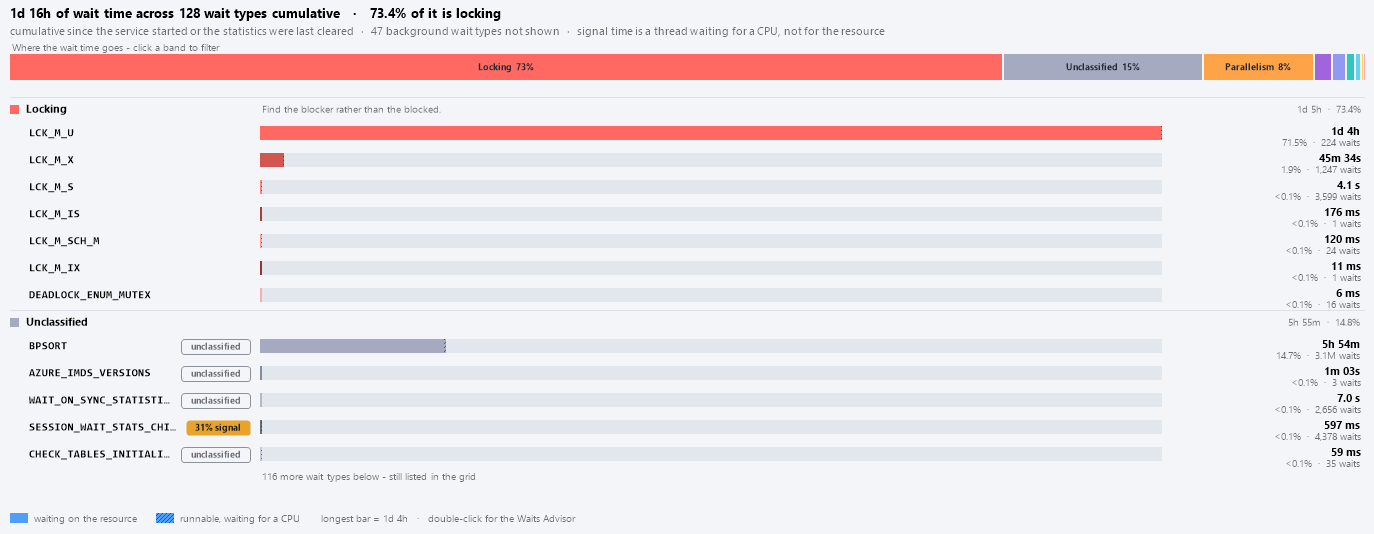
Instance waits since startup do not tell you what one connection has been waiting on. Session Waits does, from sys.dm_exec_session_wait_stats (SQL Server 2016 and later). Each session gets its total wait time since login, its signal percent (time spent runnable, waiting for a CPU) and its top three waits, such as ASYNC_NETWORK_IO 72%, LCK_M_S 20%. The chart splits the selected session by wait category, and one line says what the largest category means: Network means the client was slow to take rows that were ready, Locking means it was blocked, IO means it read more than fits in memory or storage is slow.
A second view lists every open cursor from sys.dm_exec_cursors with its age and idle time. A cursor unused for more than 10 minutes is highlighted, the usual sign of an application that opened one and forgot it.
Workload by Application
When the server is slow, the first question is which application is using it. This report reads every session’s CPU, reads and writes every ten seconds and adds the work done between readings by Application, Host, Login, Database, or App by Database. Agent job steps appear under the job name, and a long query shows up while it is still running.
The Last 7 days tab comes from a new collection, trackWorkloadByApp, which runs every two minutes and stores results in DBHealthHistory.dbo.WorkloadByAppHistory. It stacks the top ten by hour as average CPU cores kept busy and names the busiest hour.
Module Execution Statistics
Until this release nothing in the product read sys.dm_exec_trigger_stats, so a trigger that adds a second to every insert was hard to find. This database page ranks stored procedures (sys.dm_exec_procedure_stats), triggers and scalar functions (sys.dm_exec_function_stats, SQL Server 2016 and later) together by CPU, duration, reads, writes, physical reads, executions, average CPU or average duration.
The chart draws the top 20, blue for procedures, orange for triggers and green for functions. The grid gives totals, per call averages, per minute rates and each module’s share of the database total, and triggers show their parent table and events. The note says how old the oldest plan is, since every figure resets when a plan leaves the cache.
Module Execution Statistics by Database
CPU by Database says which database is busy. The instance version says which code, in which database. It shares the toolbar, columns and rules of the database page, ranks the top modules across the whole instance in the chart, and groups the grid by database with the largest total for your chosen measure first.
Plan Guides and Hints
A hint is a decision the optimizer can no longer revisit as the data changes, and hints hide in three places. A plan guide that stops validating, usually after an index or column it names was dropped, is ignored without an error. A Query Store forced plan or Query Store hint can fail every time it is applied, visible only as a failure count. And a hint written into a procedure, function, view or trigger is invisible until someone reads the code. This report reads all three for one database.
Cards count plan guides, invalid plan guides (checked with sys.fn_validate_plan_guide), forced plans, Query Store hints (SQL Server 2022 and later), hints in code, and the instance wide misguided plan executions counter, which turns to the warning color above zero. The Query Store view shows each forced plan or hint with its source (MANUAL or AUTO), failure count and last failure reason, with scripts to undo it.
The Hints in Code view scans module definitions line by line, skipping comments, string literals and quoted identifiers, so NOLOCK in a comment is not counted. NOLOCK, index hints, FORCESEEK, FORCESCAN and USE PLAN are marked as deserving a look, because each can break or mislead when the schema or data changes. Join hints, FORCE ORDER, MAXDOP, RECOMPILE, OPTIMIZE FOR, USE HINT and QUERYTRACEON are counted too. Nothing is run by the report.
Connections Over Time
When an application leaks connections or a batch job opens hundreds of sessions at 2am, you need to know whether connections spiked, when, and by how much. This report charts peak or average connections for a window from the last hour to the last 12 months, from the once a minute count of user sessions (session_id above 50) that historic monitoring stores in DBHealthHistory.dbo.Connections. A bucket is a spike when its peak is at least 1.5 times the median bucket peak and at least 10 connections above it. A by hour of day or by weekday profile separates a nightly batch window from a one-off.
Memory, hardware and the host
Memory Pressure
The Memory report shows where memory is right now and one page life expectancy figure for the instance. That misses when memory ran short, and it hides a NUMA node that is starved while the average looks fine. Memory Pressure reads the resource monitor and memory broker ring buffers in sys.dm_os_ring_buffers, plus sys.dm_os_memory_nodes, sys.dm_os_sys_memory and the per node counters.
Five state cards show the system memory state, SQL Server’s process_physical_memory_low and process_virtual_memory_low flags, memory grants pending (a warning above zero), total against target server memory, and available physical memory. A timeline marks every RESOURCE_MEMPHYSICAL_LOW and RESOURCE_MEMVIRTUAL_LOW notification: red for external pressure (Windows indicators set), orange for internal (SQL Server’s own limit), purple for both, with memory broker shrink decisions in a second lane.
The guidance under the timeline tells you what the pressure points at. External pressure means another process is using memory or max server memory is too high, and the page says so plainly when max server memory is at or above physical memory. Internal pressure points at large grants, plan cache bloat, or columnstore and In-Memory OLTP use. One bar per NUMA node shows its memory, foreign memory and page life expectancy, and a node under half the best node’s page life expectancy is drawn in orange.
The ring buffers only reach back to their last wrap, usually hours. The Last 7 days tab covers the week from a new collection, trackMemoryPressure, sampled at most every four minutes. It charts page life expectancy per node with each low memory event marked, and lists the largest memory clerks.
Host and Hardware
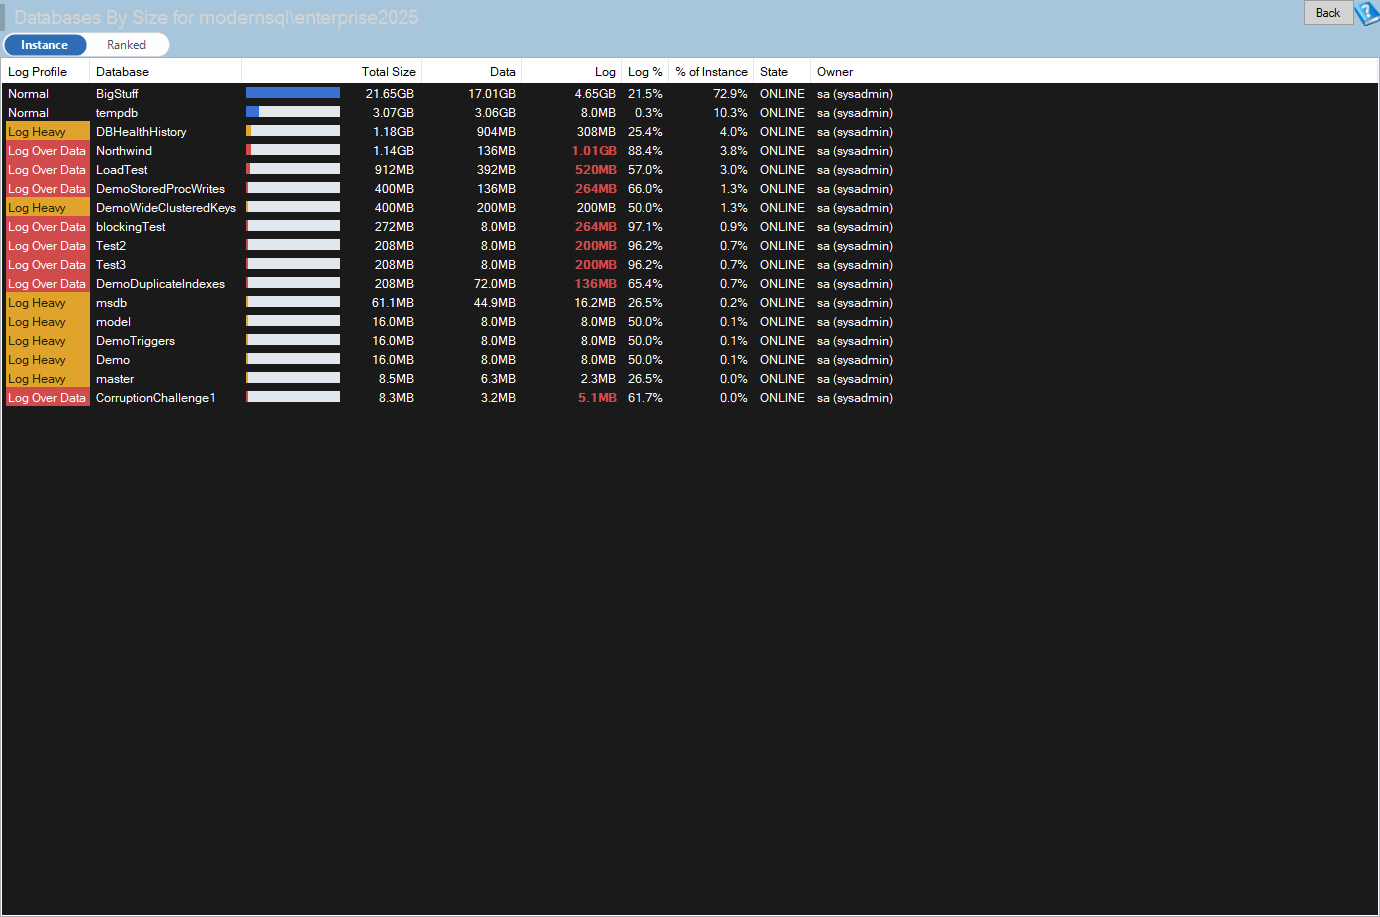
The facts you write down at the start of every health check are on one page in three cards, each row graded OK, Warning, Problem, Info or Unavailable. The CPU card warns when MAXDOP is 0 and a NUMA node has more than 8 logical processors, or when cost threshold for parallelism is still 5, and flags offline schedulers with the likely edition limit. The Memory card warns when max server memory is unset or more than 90 percent of RAM. The OS and Host card grades the power plan, instant file initialization, and service accounts. Copy it as Markdown for your write-up.
In-Memory OLTP
Memory-optimized rows cannot be paged out, so In-Memory OLTP data takes memory the buffer pool never gets back. Hash indexes add a sizing problem, and checkpoint files waiting for log truncation keep holding space. This database page reads sys.dm_db_xtp_table_memory_stats, sys.dm_db_xtp_memory_consumers, sys.dm_db_xtp_hash_index_stats and sys.dm_db_xtp_checkpoint_files on SQL Server 2014 and later.
Cards show the database’s XTP memory and its share of max server memory, the resource pool it is bound to, its memory-optimized tables (and how many are SCHEMA_ONLY, whose rows are lost on restart) and its natively compiled procedures. Checkpoint files are drawn by state, with WAITING FOR LOG TRUNCATION in the warning color.
The Hash indexes view applies three rules. Too few buckets (warning): under 10 percent of buckets empty and an average chain over 10 rows. Low cardinality key (warning): over 90 percent empty, 1,000 rows or more, and chains still over 10, meaning many rows share a key and a range index fits better. Too many buckets (informational): over 90 percent empty with short chains, wasting 8 bytes per bucket and slowing scans. At the database level, No resource pool binding is a warning when XTP memory is over 25 percent of max server memory and the database is not bound to a pool. Every fix is a script to read, such as ALTER INDEX ... REBUILD WITH (BUCKET_COUNT = n) with a suggested power of two; nothing runs from the report.
In-Memory OLTP by Database
The database page shows the instance XTP total but not who owns it. The instance version lists every database with a MEMORY_OPTIMIZED_DATA filegroup, memory-optimized tables or XTP memory in its clerk, with its XTP memory, share of max server memory, SCHEMA_ONLY count, resource pool and MAX_MEMORY_PERCENT. It uses the same 25 percent unbound pool rule, so the two pages always agree. Double-click a database to open its detail page.
Windows Event Log
Many root causes never reach the SQL Server error log. This report reads the host’s System and Application logs for the last 24 hours, 7 days or 30 days and sorts SQL relevant events into Storage, Cluster, Memory, Shutdown, SQL Service, Security or Other. The curated list includes disk 153, storport 129, FailoverClustering 1135, Resource-Exhaustion-Detector 2004, EventLog 6008 and Kernel-Power 41, and SQL Server’s own 823, 824, 825 and 833 count as Storage. A timeline puts each category in its own lane next to a lane for the SQL Server error log, so a disk timeout and the 833 that followed it line up.
Failover Cluster
For a failover cluster instance, this page answers which node owns it, where it could go, and when it last moved. It draws every possible owner with the current one highlighted, flags nodes that are down or paused and an instance with nowhere left to fail over to. The quorum panel treats forced quorum as a problem and an even number of voting nodes with no witness as a warning, and the failover history is rebuilt from the error logs.
Security and compliance
Sensitive Data
Every PCI DSS, HIPAA or privacy review starts with the same question: where is the personal and payment data, and is it classified? The page opens on the existing classifications from sys.sensitivity_classifications (or SSMS extended properties before 2019). Press Scan to find what is not classified yet.
The scan always matches column names. Each name is split into words (CustomerSSN becomes “customer ssn”) and matched against email, phone, address, name, date of birth, US SSN, payment card, IBAN and bank account, national ID, credentials, health, financial and IP address patterns. The data type has to fit and describing words are recognized, so EmailSentFlag, CardType and PasswordChangedDate are not flagged, and bit, uniqueidentifier and xml columns never are.
Value sampling is off by default and asks you to confirm the first time you turn it on. It reads TOP 100 rows per table by default (maximum 1000), up to 500 tables, for at most 5 minutes, skipping tables over 10 GB and reading with READ UNCOMMITTED by default, and you can cancel it. Card numbers are validated with an issuer prefix and a Luhn check, IBANs with mod 97, and SSNs exclude never-issued ranges. Sampled values are never stored, shown, logged, exported or put in error text. The grid and the history hold only counts, such as “47 of 100 sampled values match SSN pattern.”
Confidence is High when the name matched and at least half the sampled values match, and Medium or Low on weaker evidence. Suggested types and labels are the ones SSMS uses. Apply Selected Classifications previews the script with Run, Copy Script and Save Script: ADD SENSITIVITY CLASSIFICATION on SQL Server 2019 and later, extended properties on 2012 to 2017, and disabled on 2008 R2 and earlier. Dismissals are remembered across scans, and results are kept in DBHealthHistory (the latest two scans per database).
Sensitive Data by Database
The instance view answers which databases hold card numbers or SSNs and whether they are classified. One row per user database shows classified and suggested columns, High confidence unclassified columns (the database turns red if there are any), card and SSN column counts, the last scan, and TDE state from sys.databases. Scan All Databases scans every database that can be opened.
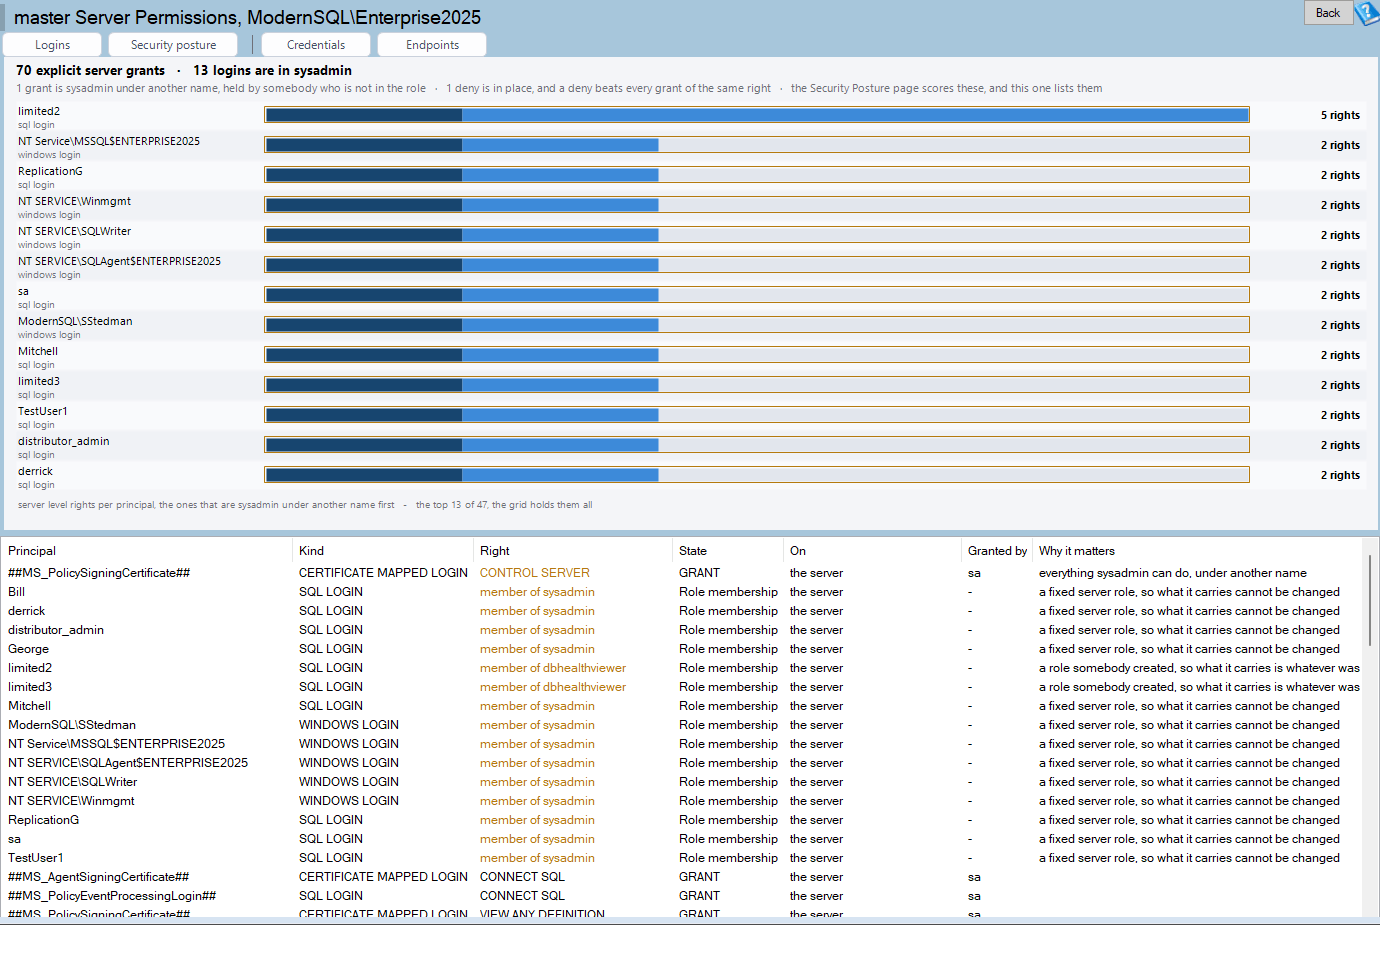
Permissions Matrix
An auditor’s first question is what a login can do in every database. The Matrix view puts every login (Windows groups included) in a row and every database in a column. Cells use short codes such as SA, DBO, O for db_owner, W and R for writer and reader, and +N for explicit permissions, with nested roles expanded. Cells are red for owner level access, orange for administrative, amber for changing data and blue for reading.
The Findings view lists the risky access worst first: permissions granted to public on a user database or schema, and CONTROL on a database (problems); guest enabled in a user database, db_owner members who are not sysadmin, IMPERSONATE grants, cross database ownership chaining, an owner SID that matches no login, and TRUSTWORTHY ON (a problem when the owner is sysadmin). Click a cell for the role chain and a script that reproduces the same grants.
Security Posture (Azure SQL Health Monitor)
Azure SQL Database has a different attack surface from a server: a firewall one rule can open to the whole internet, an Allow Azure services switch that admits other tenants’ resources, and users who carry passwords inside the database. This page grades firewall rules, authentication, db_owner membership, guest and public grants, TDE, auditing and data protection. A rule from 0.0.0.0 to 255.255.255.255, or any range of 65,536 addresses or more, is a fail, as is TDE off. Settings T-SQL cannot see, such as Defender for SQL, are marked Not checked rather than guessed. Script fixes writes one script, with judgment calls commented out, and nothing is changed for you.
Cost, capacity and uptime
Chargeback
On a shared server, finance wants to know which database and which team should pay for it. Chargeback splits the server’s cost over a month, a quarter or a custom range by each database’s share of CPU, I/O, storage and buffer pool. The shares come from a new hourly collection, trackChargeback, stored in DBHealthHistory.dbo.ChargebackUsage (history version 1602): CPU from the Workload by Application history, I/O from sys.dm_io_virtual_file_stats deltas, storage from file sizes, and buffer pool pages. History is kept at least 400 days.
You set the cost model under Cost Settings, saved in DBHealthHistory so everyone sees the same numbers. Either enter a monthly server cost split by weights (40 percent CPU, 20 percent I/O, 30 percent storage and 10 percent memory by default), or enter rates per core, per GB of storage, per GB of buffer pool and per TB of I/O.
The system databases and DBHealthHistory are shared overhead, shown on their own or spread over the others in proportion to their cost. Tag each database with an owner and cost center, then switch the treemap to By Cost Center. Databases created or dropped mid-period are prorated. The Estate view covers every connected instance, and everything exports to Excel.
License and Edition Footprint
Before a true-up or a migration you need to know how many cores you license, whether anything needs Enterprise, and what Standard would save. This report reads sys.dm_os_sys_info, sys.dm_db_persisted_sku_features in every database, Resource Governor, the availability group catalog and Agent job steps, and gives a verdict on moving to Standard: green when nothing blocks it, amber when only removable features block it, red when a capacity limit or a structural feature is in the way.
Cores are counted as every virtual core with a minimum of 4 on a virtual machine, or every physical core with a minimum of 4 per processor on a physical host, in two core packs. Prices default to $15,123 per Enterprise pack and $3,945 per Standard pack, and you can type your own.
The grid lists each Enterprise feature with the Standard version that allows it: data compression, partitioning, CDC, columnstore, In-Memory OLTP and database snapshots since 2016 SP1, TDE since 2019, Resource Governor since 2025. A readable secondary, more than two replicas or a distributed availability group blocks the move outright, and an Agent job step using ONLINE=ON is flagged too. Capacity rows check Standard’s limits (24 cores and 128 GB of buffer pool on 2016 to 2022, 32 cores and 256 GB on 2025). The Estate view assesses every connected instance, and the page reminds you this is a planning estimate, not a quote.
Consolidation Planner
Migration Planner sizes a server for one instance. The Consolidation Planner, on the Tools menu, asks whether several instances will fit on one new server or VM. Pick the instances and a period, describe the target (cores, a CPU speed factor, memory, storage, IOPS and MB/s), and it stacks each instance’s history from its own DBHealthHistory in 15 minute buckets. Because the load is lined up in time, two instances that each peak at 4 cores at different times combine to less than 8. A fit table grades each resource Pass, Tight (under 20 percent headroom) or Fail, with a license estimate, and the plan exports to HTML or Excel.
Availability SLA
Alerts tell you an instance restarted, not what the month’s uptime was. The monitoring service now checks each instance every thirty seconds and stores changes in AvailabilityMonitor and AvailabilityOutage. The report joins a restart and the failed checks around it into one outage and gives uptime percent against a target from 99 to 99.99 percent, outage count, total and longest downtime, and mean time between failures. Mark an outage as planned to leave it out of the figure. The percent is never rounded up, so 99.8996 reads 99.899, not 99.9.
Table Growth History
Deciding what to archive, partition or purge starts with which tables are growing and how fast. A new daily collection, trackTableGrowth, records rows and reserved, data, index and unused space from sys.dm_db_partition_stats for every table of 10 MB or more, kept 400 days by default. The grid ranks tables by MB and rows per day over 7, 30 and 90 days, with sizes projected 6 and 12 months out. Growth is a least squares slope, so one purge or load does not decide the rate.
Key Exhaustion by Database
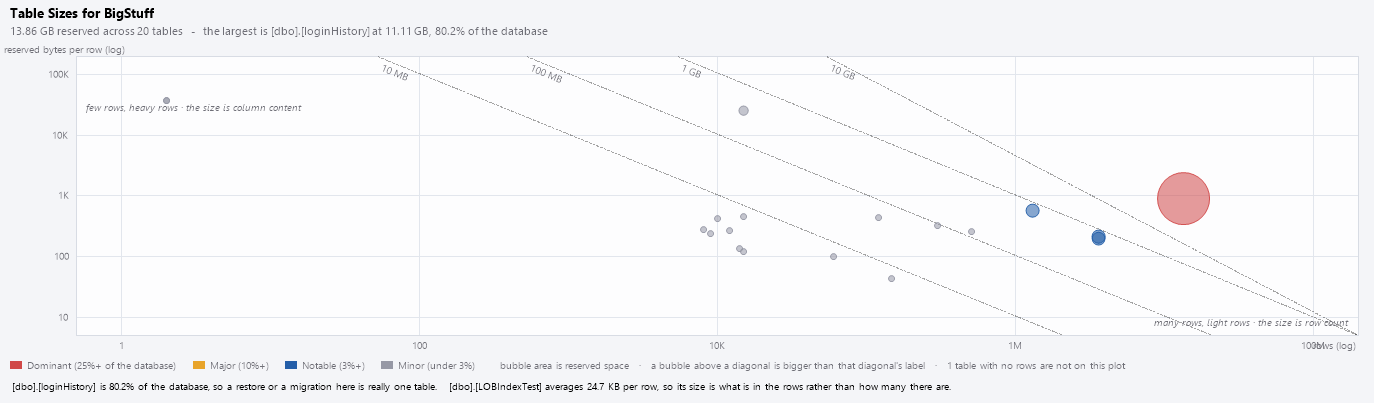
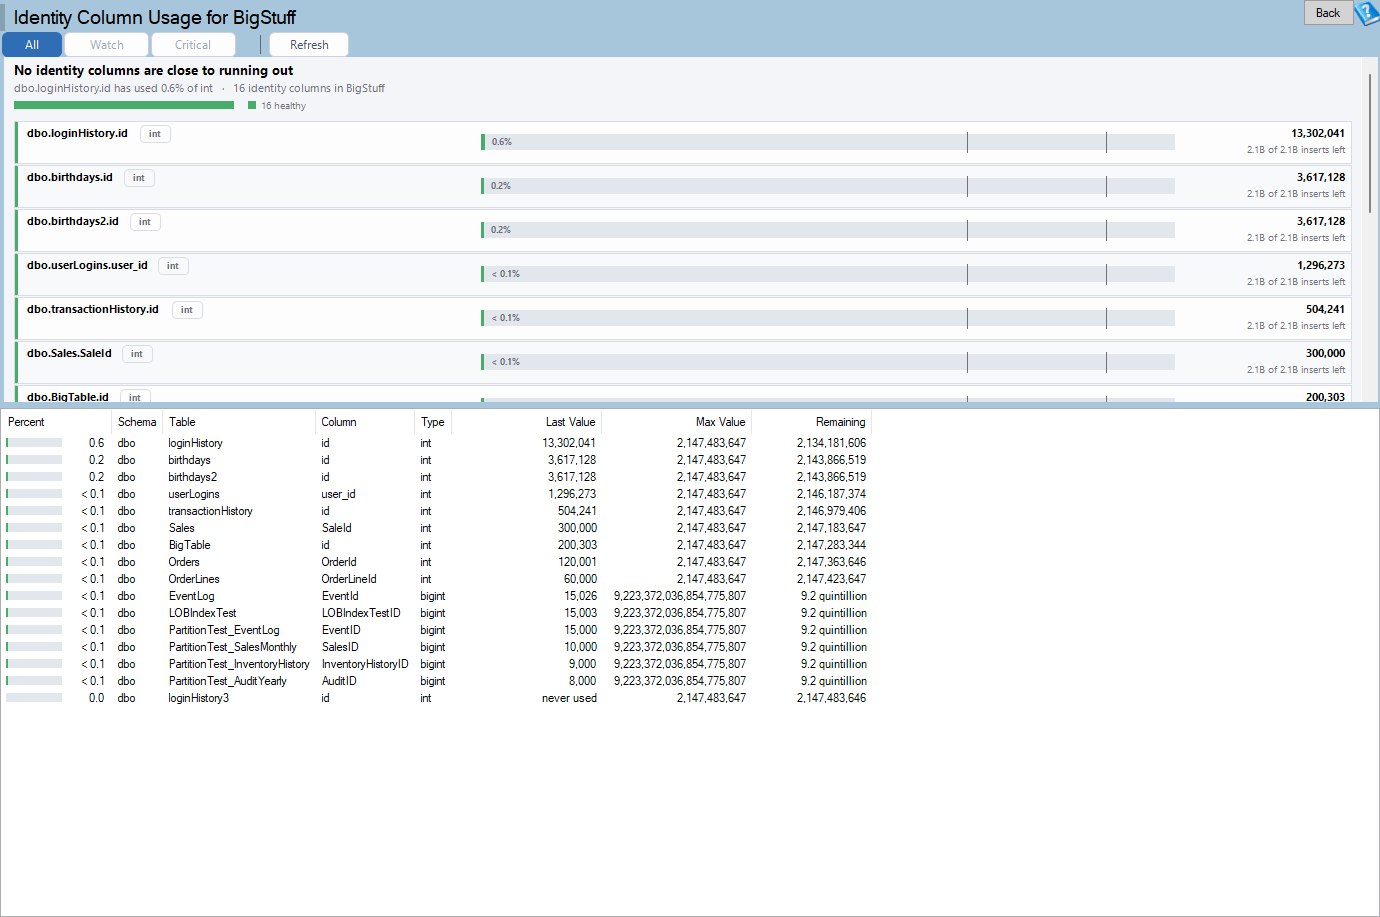
The Identity Column Usage page has been renamed Key Exhaustion and now covers sequences as well as identity columns. It catches int or smallint sequences near their maximum and CYCLE sequences that feed a key, which wrap back to their minimum and fail the next insert with a duplicate key error. That is why a CYCLE sequence behind a primary key, unique constraint or unique index is a Watch finding at any percent.
The new instance report runs the same queries in every database except tempdb and model and lists the 50 worst keys. Critical means 90 percent or more used or projected to run out within 90 days; Watch means 70 percent or more, a CYCLE sequence feeding a key, or projected to run out within a year. The projection comes from a new daily collection, trackKeyExhaustion, into KeyExhaustionHistory: days left equals values left divided by values used per day over the last 30 days, and it needs at least 7 days of history.
Data Compression
Which indexes are worth compressing? This database page lists every heap, clustered, nonclustered and columnstore index with its current compression, size and read/write mix from sys.dm_db_index_operational_stats. It recommends PAGE when updates are under 20 percent and range scans over 75 percent, or when updates are under 5 percent; ROW otherwise; and no change under 100 MB or when the saving is under 10 percent. Estimate top 25 runs sp_estimate_data_compression_savings on the largest candidates. The ALTER INDEX ... REBUILD script is shown, never run.
Feature health: CDC, temporal, full-text and row versioning
CDC and Change Tracking
When the CDC capture job stops, nothing complains, and the log cannot truncate past what CDC has not read. The first sign is often a full log drive. This page grades the capture job, latency, errors, log reuse wait and cleanup. Latency over 300 seconds is yellow; a missing or stopped capture job, or SQL Server Agent not running, is red. When log_reuse_wait_desc is REPLICATION with no publication, the page says CDC is holding the log. Change tracking with auto cleanup off is flagged because its internal tables only grow.
Temporal Tables
History tables quietly grow to many times the size of the table they version. This page lists every system-versioned table and warns on no retention policy (HISTORY_RETENTION_PERIOD is INFINITE), retention disabled at the database level, a heap history table, and history more than 10 times the current table’s size. A script pane shows the fix for the selected table.
Full-Text Search
Full-text search fails quietly, and users notice stale results first. This page grades each catalog and index: red for a catalog whose populate status is Disk full, paused or Shutdown; yellow for an index that is disabled, has change tracking OFF, has more than 30 fragments, has a population running over 24 hours, or has failed rows. Fix scripts are shown, never run.
Version Store and ADR
Row versions live in the tempdb version store for RCSI and snapshot isolation, and in the persistent version store inside the database when Accelerated Database Recovery is on (SQL Server 2019 and later). When either grows, the question is what is holding it. This page shows the PVS size, the database’s share of tempdb’s version store, and names the cleanup blocker: an open transaction with its session, login and host, a snapshot reader, a lagging availability group secondary, or aborted transactions. Red means PVS over 20 percent of used space or a holding transaction open over an hour; yellow means over 10 percent or a transaction open over ten minutes.
Version Store and ADR by Database
The instance page shows a card for every database that keeps row versions, worst first, the tempdb version store total from sys.dm_db_file_space_usage, and the longest running snapshot transaction on the instance. Double-click a database to open its page.
New features
Thirty features ship alongside the reports. The theme is hearing about problems sooner and having a calmer product when something does go wrong.
Alerts and history
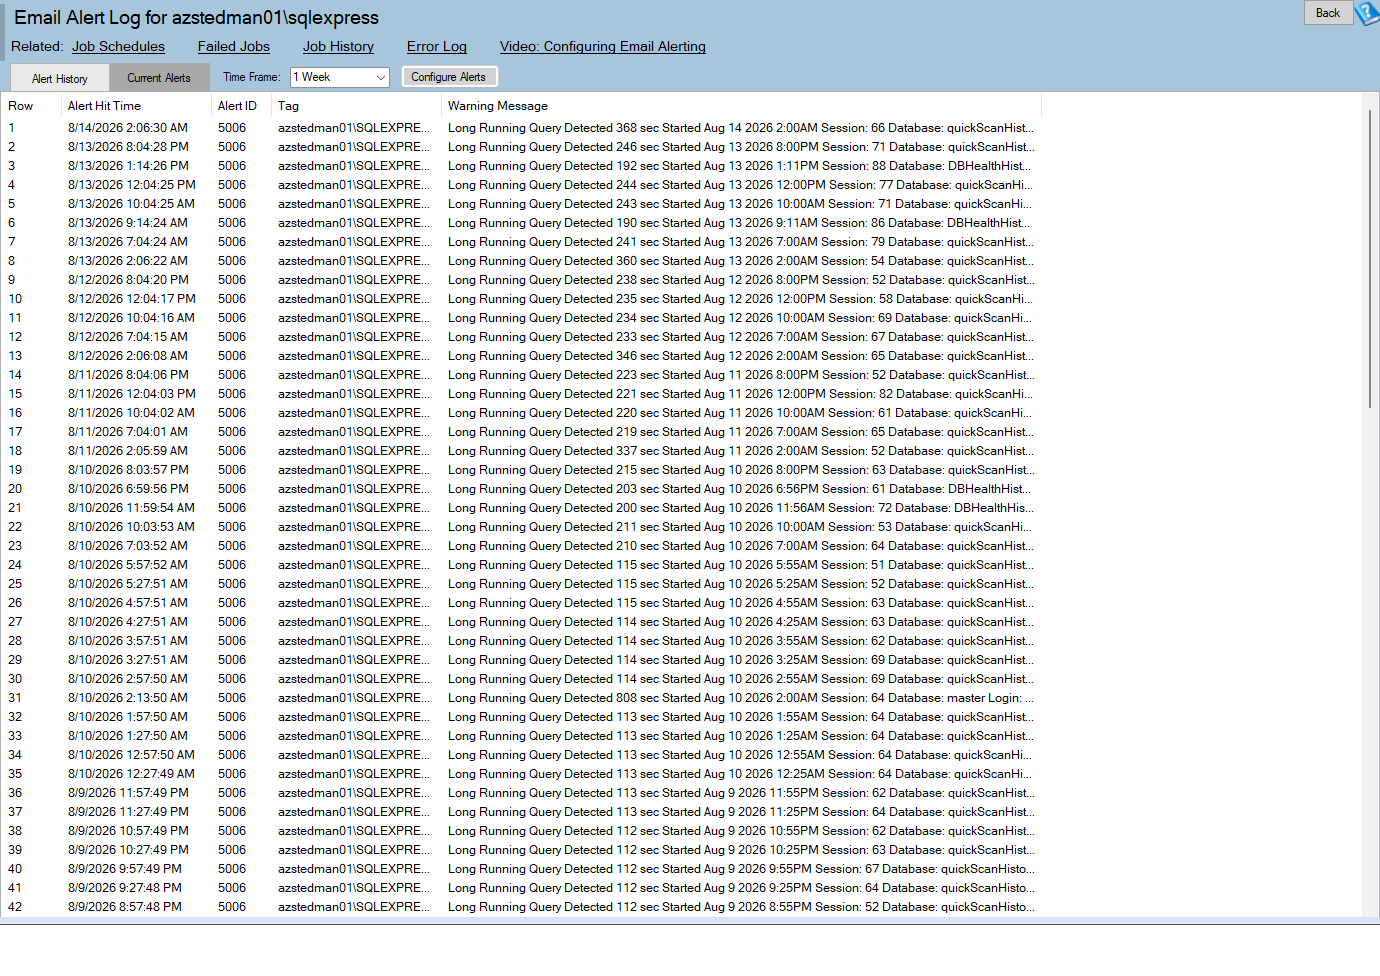
- Twelve built-in alerts (5011 to 5022): Agent job failed, Agent job running long, availability group replica not healthy, AG synchronization state changed, AG send or redo queue high, deadlock detected, 823, 824 and 825 I/O errors, high severity errors, SQL Server restarted, SQL Agent not running, log percent full, and TempDB space.
- Custom T-SQL alerts with their own dialog: write a check and it alerts like the built-in ones. A copied built-in alert now keeps its own thresholds and exclusions.
- New history collections for memory pressure, workload by application, daily table sizes, hourly chargeback usage, instance availability, and identity and sequence values.
- A self-repairing history database. A DBHealthHistory with dropped tables used to report “Historic Version Stuck” on every start. The missing tables are now recreated empty, with a warning naming them.
- Faster Quick Scan and 24/7 monitoring.
Everyday use
- A redesigned performance dashboard. The start page is rebuilt around a new set of performance cards.
- Save as Excel for any grid that could be saved as CSV, from the right-click menu or Export This Page. Cells are written as text, so a value starting with =, +, – or @ opens as literal text rather than a formula.
- Find, filter and sort now work in Deadlock Advisor, Needs Parameters Advisor, Connect to Multiple Servers and the Technical Debt object viewer.
- Plain English error messages for permission denied, timeouts, deadlocks, a read only database or a full log, with the original text in Copy details.
- A friendlier crash dialog with a summary first, details behind Show details, and a crash log at
%LOCALAPPDATA%\StedmanSolutions\DatabaseHealth\CrashLog.log. - Fewer interruptions: toast notifications instead of blocking message boxes, consistent confirmation wording, and the Thanks for Using reminder removed.
- Settings validation as you type, instead of silently changing a bad index, CHECKDB, backup or retention value.
- Remembered windows: PageWalker and Performance Viewer keep their size and position, and Log Reader asks for its backup file in one labeled dialog.
Connections
- Safe server removal asks first and offers Undo for the rest of the session.
- Registered Servers round trip keeps each server’s alias and type through SSMS export and import, and bulk import tests credentials in the background with a Skip remaining option.
- DR joins the list of server types.
Reports
- Key Exhaustion replaces Identity Column Usage, adding sequences and projected exhaustion dates.
- Backup Status gains a Last Diff column for the most recent differential backup.
- Query Store reports are hidden for the model database.
Quick Scan
- Three new checks: 109 finds
@@SERVERNAMENULL or empty (the fix issp_addserverwith ‘local’ and a service restart), 110 finds a linked server pointing back at its own instance (replication’s own local entries are skipped), and 111 finds@@SERVERNAMEnot matching the actual server name. - Ola Hallengren’s maintenance solution is no longer bundled. Quick Scan points to Ola’s site so you always install the latest version.
Tray and service
- Notification settings on the tray’s Settings tab turn balloons on or off and set the repeat interval.
- Snooze notifications for 15 minutes, 1 hour, 4 hours, until 8:00 AM tomorrow, or until turned back on, stored per user so it survives a reboot for patching.
- Health you can read without color: a green circle with a check for Healthy, a red triangle with an exclamation mark for Attention, and a gray square with a dash for Inactive.
- Balloon clicks open History filtered to the server, procedure and status the balloon was about.
- Nothing goes quiet: notifications held back by the repeat interval are counted, and a failed poll or settings reload is reported.
- A service lifecycle log at
%ProgramData%\DatabaseHealthMonitor\Logs\ServiceLifecycle.log, and a failed start reported to the Application event log with the step that failed.
Safer tools
- Schema Drift shows the target server, database and exact SQL before it pushes a CREATE or ALTER, and reports a failed results email.
- Space Recovery asks before Do it now runs, and a failed or stopped run ends with a summary and a follow-up script of only the statements that did not complete.
- Decryptionator’s buttons and DROP guard checkbox say more clearly what they do.
Bug fixes
This release closes 934 tickets, including 48 crashes and 42 fixes in Azure SQL Health Monitor. Most of the rest correct wrong or misleading results, reports that crashed or went blank on a query timeout instead of saying so, leaked connections and drawing resources, and grids and charts that did not fit at 1280×900 or in split view.
Get version 4.1625
If any of these reports answers a question you keep asking by hand, download Database Health Monitor 4.1625 and point it at one of your instances. Set up historic monitoring so the new collections start filling, and the 7 day tabs, chargeback figures and key exhaustion projections will have data within days.