Monitoring CPU Load with Database Health Monitor
Understanding SQL Server CPU Utilization with Database Health Monitor
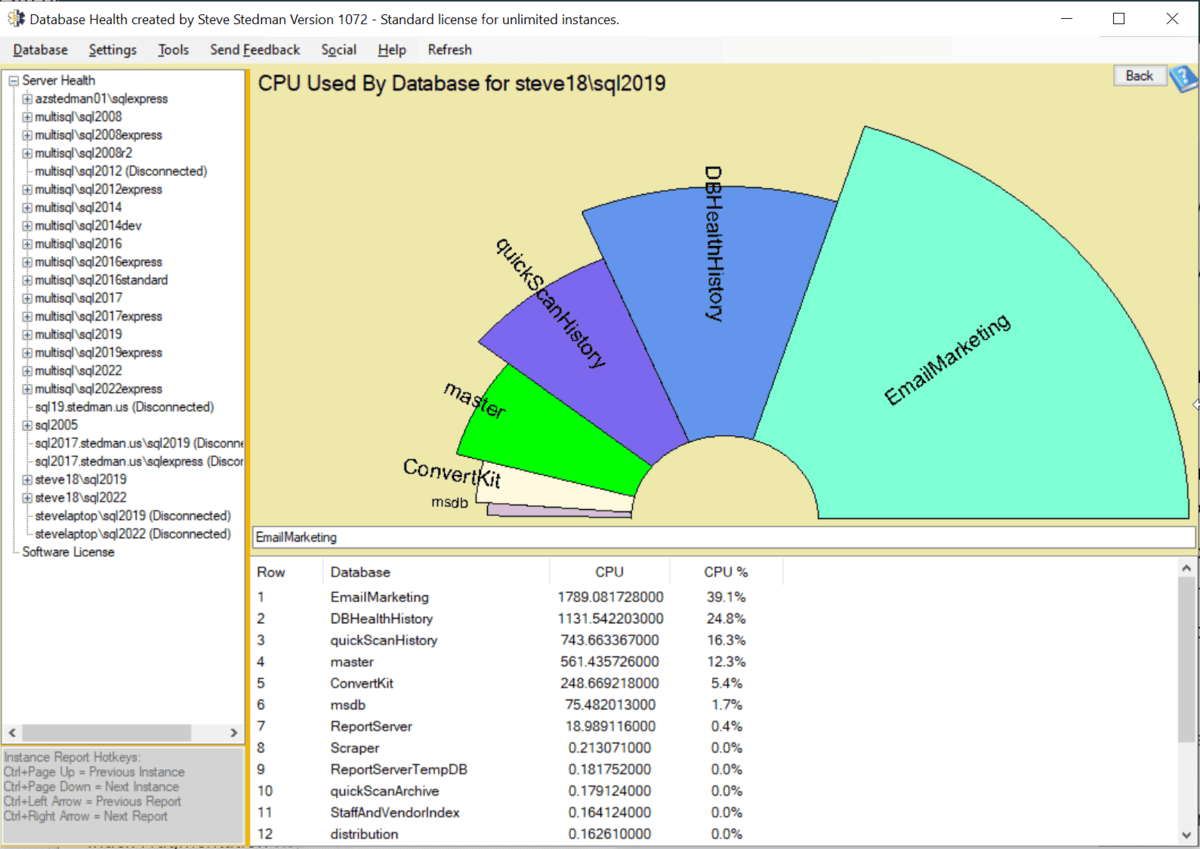
Monitoring your SQL Server’s CPU usage is a critical aspect of maintaining a well-performing and reliable database environment. One common challenge for database administrators (DBAs) is pinpointing times of peak CPU activity and identifying the workloads contributing to high usage. This is where Database Health Monitor, a free tool from Stedman Solutions, comes to the rescue with features like the CPU by Hour report.
What is the CPU by Hour Report?
The CPU by Hour feature in Database Health Monitor provides a visual representation of CPU utilization patterns throughout the day. By analyzing this chart, you can:
- Spot periods of unusually high CPU usage.
- Identify trends that could signal a problem, such as consistently high usage during specific hours.
- Correlate CPU spikes with workload or query execution to diagnose issues.
This data is crucial for planning maintenance tasks, optimizing workloads, and ensuring your SQL Server runs efficiently.
Why CPU Monitoring Matters
SQL Server relies heavily on CPU for query execution, indexing, and other critical operations. Excessive CPU usage can lead to performance degradation, query timeouts, and frustrated end-users. Some scenarios that might cause high CPU usage include:
- Poorly Optimized Queries: Queries with missing indexes, inefficient joins, or poorly designed execution plans can consume more CPU than necessary.
- Inadequate Hardware Resources: Servers that are underpowered or hosting multiple resource-heavy applications might struggle to meet CPU demands.
- Uncontrolled Parallelism: When SQL Server executes queries using parallel threads without proper configuration, it can overwhelm CPU resources.
- Background Processes: Scheduled jobs, maintenance tasks, or third-party applications running at peak hours can strain the CPU.
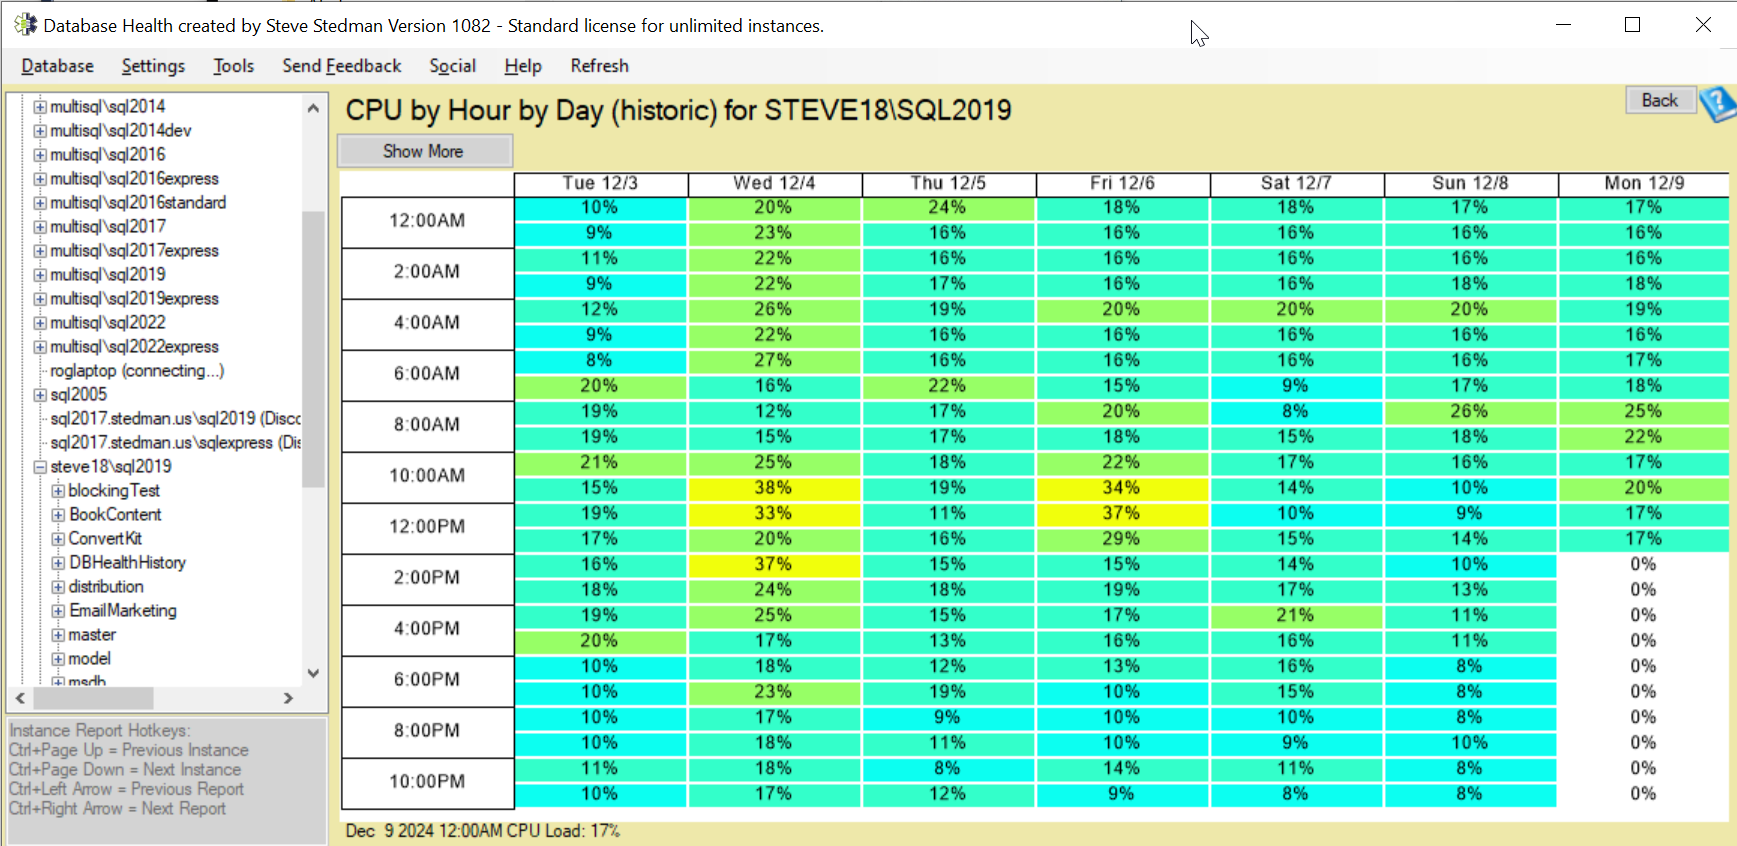
Using the CPU by Hour Report
With the CPU by Hour feature, you get a clear, easy-to-read chart that illustrates CPU usage patterns hour by hour. Here’s how you can use this information to optimize your SQL Server environment:
- Identify Peaks: Determine the times when CPU usage is at its highest. This helps in planning tasks like index rebuilding or ETL operations during off-peak hours.
- Correlate Workloads: Use other Database Health Monitor features, such as the query analyzer or wait stats report, to correlate high CPU usage with specific queries or processes.
- Plan Resource Allocation: If your server consistently experiences high CPU usage, consider increasing CPU resources, tuning queries, or redistributing workloads to less active times.
- Proactive Maintenance: Use the insights gained to optimize indexes, adjust query execution plans, or modify server configurations for better performance.
How Database Health Monitor Simplifies Monitoring
Database Health Monitor is more than just a monitoring tool; it’s a comprehensive solution for maintaining your SQL Server environment. With features like the CPU by Hour report, you can proactively identify issues before they escalate into critical problems. Best of all, it’s free to use, making it accessible to DBAs at every level.
The Database Health Monitor also provides a range of reports that enable you to identify trends and potential issues related to CPU usage. You can generate reports on CPU usage, CPU history, and CPU duration, among other things. These reports can be customized to meet your specific needs and exported to a range of formats, including Excel and HTML.
Overall, monitoring CPU load with the Database Health Monitor is a critical part of database performance monitoring. By tracking CPU usage and providing insights into CPU history and trends, the tool enables you to identify potential performance bottlenecks and take corrective action to optimize query execution and ensure that your database environment is running smoothly. If you want to learn more about the Database Health 
Try Database Health Monitor Today
Whether you’re troubleshooting performance issues, planning upgrades, or simply looking to gain better insights into your SQL Server, Database Health Monitor is your go-to tool. Download it today from DatabaseHealth.com and start taking control of your SQL Server environment.
For more tips on SQL Server monitoring and optimization, visit Stedman Solutions or reach out to us via our contact page. If you’re interested in ongoing support and peace of mind, consider our SQL Server Managed Services. We’ll handle the monitoring so you can focus on growing your business.