CPU Load for Hour
You can get to the CPU Load by Hour report by drilling down on the CPU By Hour report.
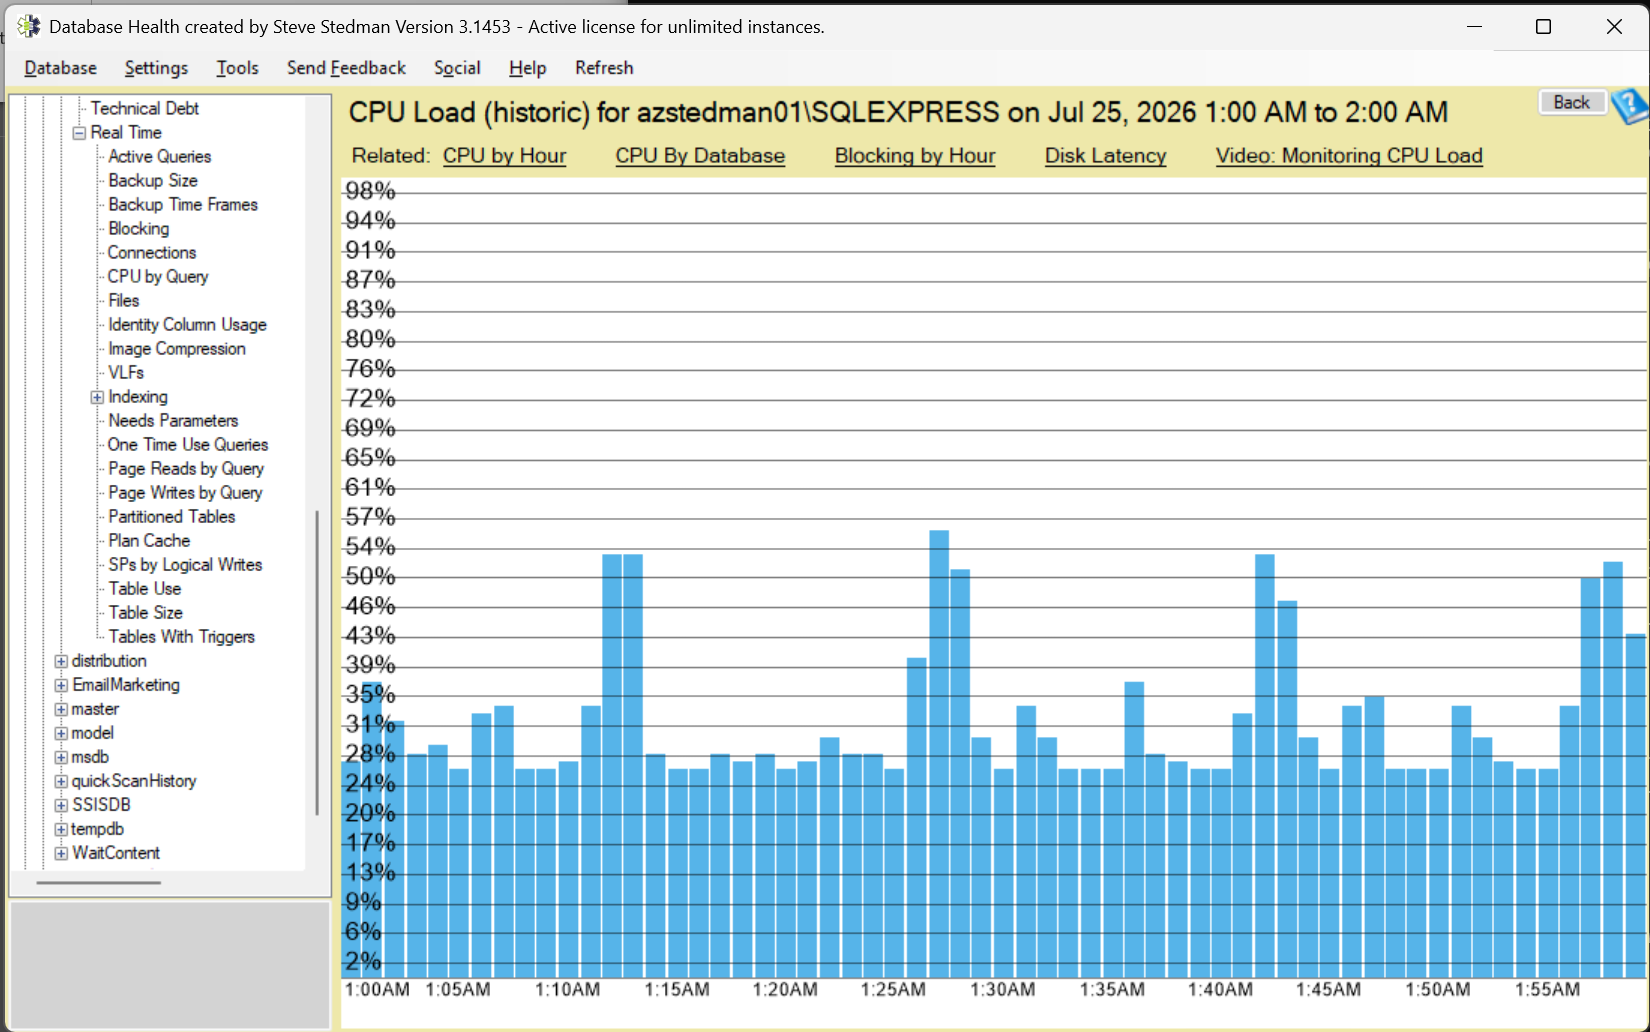
The CPU Load (historic) report shows the actual CPU load recorded for a single hour on a monitored instance, rather than the hourly average.
How to get to the CPU Load for Hour Report
Get to it by clicking any hour on the CPU by Hour by Day (historic) report. The heat map cell you click shows the average CPU for that hour; this report breaks that hour open and charts every CPU sample that was collected during it — normally one per minute, so up to 60 bars. This makes it easy to tell a sustained hour of high CPU apart from an hour that only looks busy because of one short spike.
The chart is always scaled from 0% to 100%. Hovering over a bar shows the timestamp of the sample, the total CPU load, and how that total splits between SQL Server and everything else running on the machine.
Use the Back button to return to the CPU by Hour by Day report.
CPU Load for Hour
This report reads from the DBHealthHistory database, so CPU load is only available for hours when the Database Health Monitor service was running and collecting data. Hours with no collected data show “No CPU load was recorded for this hour.”