Are You Making These Common SQL Server Wait Stats Mistakes?
SQL Server wait statistics are one of the most powerful diagnostic tools for identifying performance bottlenecks: yet they’re also one of the most commonly misunderstood. These metrics tell you where SQL Server is spending time waiting for resources, but interpreting them incorrectly can lead you down the wrong path, wasting hours on unnecessary configuration changes or missing the real problem entirely.
If you’ve ever looked at your wait stats and felt overwhelmed by CXPACKET waits, or cleared your statistics “for a fresh start” only to lose critical diagnostic data, you’re not alone. Let’s walk through the most common mistakes DBAs and developers make when analyzing sql server wait statistics: and how to avoid them.
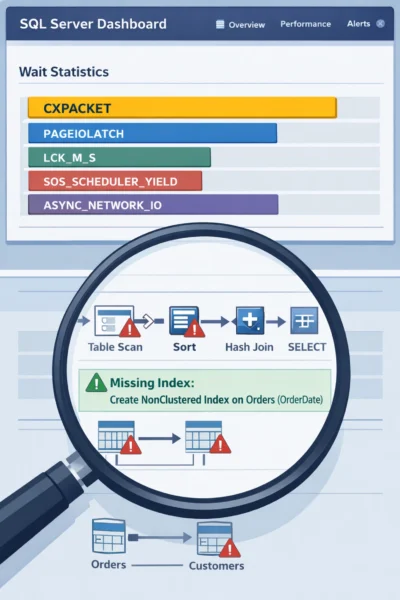
Mistake #1: Treating CXPACKET as a Problem Instead of a Symptom
CXPACKET waits appear when SQL Server parallelizes a query across multiple CPU cores, and one thread finishes before others, causing it to wait. Many DBAs see CXPACKET at the top of their wait stats and immediately assume the solution is adjusting MAXDOP (Maximum Degree of Parallelism) or Cost Threshold for Parallelism settings.
This is a misdiagnosis.
CXPACKET itself isn’t the disease: it’s a symptom pointing to something else: typically an expensive query that’s scanning large amounts of data. The wait occurs because SQL Server is working hard on a poorly optimized operation that genuinely benefits from parallel execution.
The right approach:
- Identify which specific queries are generating high CXPACKET waits using query plan analysis
- Look for large table scans, missing indexes, or inefficient join operations in those plans
- Optimize through proper indexing strategies or query rewrites first
- Only consider MAXDOP adjustments after you’ve addressed the underlying query performance issues
Changing MAXDOP without fixing the actual query problem might reduce CXPACKET waits, but it often makes the original query run even slower by removing its ability to leverage parallel execution effectively.
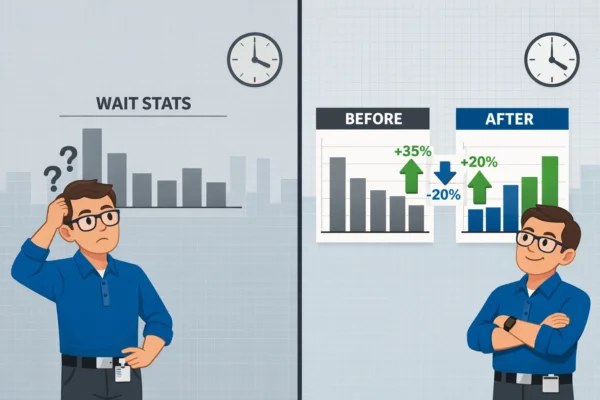
Mistake #2: Clearing Wait Stats Before Gathering Enough Data
One of the most damaging mistakes is running DBCC SQLPERF('sys.dm_os_wait_stats', CLEAR) too frequently or at the wrong time. Wait statistics are cumulative since the last SQL Server restart or manual clear, and this historical context is incredibly valuable.
Why this matters: A single snapshot of wait stats shows you what has accumulated over time: possibly reflecting yesterday’s batch job rather than today’s user complaints. Without a baseline comparison, you’re essentially flying blind.
The correct methodology:
- Capture a baseline snapshot of wait stats during normal operations
- Wait 5–15 minutes (or during the time period when symptoms occur)
- Capture a second snapshot
- Calculate the delta between the two snapshots to see what actually increased during your observation window
This delta analysis reveals what’s happening right now versus what accumulated over days or weeks. It’s the difference between diagnosing an active problem and chasing ghosts from historical workloads.
Many organizations create scheduled jobs to capture wait stats every 15–30 minutes, storing the results in a monitoring table. This creates a trending baseline that helps you compare current performance against historical norms: essential for sql server performance monitoring.
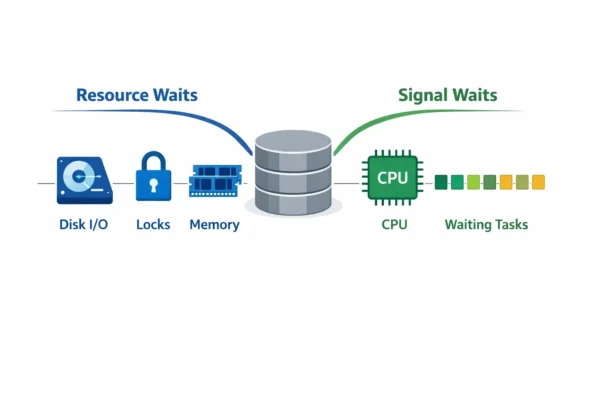
Mistake #3: Not Understanding Signal Waits vs Resource Waits
Wait statistics are broken into two components that tell very different stories:
- Resource waits: Time spent waiting for a specific resource (like disk I/O, locks, or memory)
- Signal waits: Time spent waiting in the runnable queue after the resource became available, but before the CPU was free to process it
If you see high signal wait times relative to resource wait times, your problem isn’t the resource itself: it’s CPU pressure. The query got what it needed (disk completed its read, lock was granted), but then had to wait in line for available CPU cycles.
This distinction completely changes your troubleshooting approach:
- High resource waits + low signal waits = Focus on the specific resource (add indexes for IO waits, resolve blocking for lock waits)
- High signal waits = Address CPU bottlenecks (identify expensive queries, check for parallelism issues, consider hardware upgrades)
Ignoring this breakdown leads to optimizing the wrong component. You might add faster storage to reduce PAGEIOLATCH waits when the real problem is CPU saturation causing signal waits.
Mistake #4: Ignoring “Benign” Waits That Actually Matter
Most wait stats analysis scripts filter out supposedly “benign” waits like BROKER_QUEUE_TASK_WAIT, SLEEP_TASK, and DBMIRROR_DBM_EVENT. While these waits are often harmless background noise, dismissing them entirely can hide real performance problems.
For example, ASYNC_NETWORK_IO appears in many filtered lists, yet it reveals a critical bottleneck that’s commonly misdiagnosed. This wait type doesn’t indicate a SQL Server or network problem: it means SQL Server has prepared the result set and is waiting for the client application to consume the data faster.
Common causes of ASYNC_NETWORK_IO waits:
- Applications processing results row-by-row instead of in batches
- Slow client machines that can’t handle the data volume
- Network bandwidth limitations between application and database servers
- Queries returning unnecessarily large result sets
DBAs often waste time tuning SQL Server configuration or investigating network infrastructure when the actual fix requires rewriting application code to process data more efficiently. No amount of sql server performance tuning will fix an application that’s the bottleneck.
Similarly, high DBMIRROR_DBM_EVENT waits might seem benign if you’re using database mirroring, but they can indirectly point to disk I/O problems on your mirror server that will eventually impact failover performance.
Mistake #5: Making Configuration Changes During Active Incidents
When production is melting down and users are complaining, the pressure to “do something” is intense. This often leads DBAs to make multiple configuration changes simultaneously: adjusting MAXDOP, changing memory settings, updating Cost Threshold values: hoping something sticks.
This approach creates chaos. If performance improves (or worsens), you won’t know which change was responsible. You’ve also lost the ability to compare before-and-after metrics meaningfully.
The better approach:
- Stabilize the immediate situation by identifying and addressing the worst offender (usually a specific runaway query or blocking chain)
- Document the wait stats, query plans, and system state during the incident
- Make one targeted change at a time in a controlled manner
- Measure the impact before proceeding to the next change
- Save all diagnostic outputs with timestamps and brief incident summaries for future pattern recognition
Building this institutional knowledge prevents you from repeatedly troubleshooting the same issues and helps identify systemic problems versus one-off incidents.
How Database Health Monitor Simplifies Wait Stats Analysis
Manually collecting wait stats snapshots, calculating deltas, and filtering noise is time-consuming and error-prone. Database Health Monitor provides real-time wait statistics visualization that automatically handles the heavy lifting.
The platform continuously captures wait stats at configurable intervals, calculates deltas automatically, and presents trending data that makes it immediately obvious when patterns change. Instead of writing and maintaining your own monitoring queries, you get instant visibility into:
- Current top waits with delta calculations over your chosen time window
- Historical trending to identify recurring patterns
- Signal wait vs resource wait breakdowns
- Automatic correlation with query performance and blocking events
This means you can spend less time collecting data and more time actually solving performance problems. When an incident occurs, you’ll already have the baseline comparisons you need to make informed decisions quickly.
Best Practices for Wait Stats Analysis
Start with proper baselines. Understand your normal wait patterns during different workload periods (morning startup, midday peak, nightly batch processing).
Focus on changes, not absolutes. A high wait count means nothing without context about whether it’s increasing, decreasing, or stable.
Investigate the queries, not just the waits. Wait stats tell you where to look, but query plans and execution metrics tell you what to fix.
Document everything. Save your wait stats snapshots, query plans, and configuration settings with timestamps. Future you will be grateful.
Use the right tools. Manual wait stats analysis works, but modern monitoring solutions like Database Health Monitor eliminate the tedious parts so you can focus on solutions instead of data collection.
Wait statistics are powerful when used correctly, but the common mistakes we’ve covered can send you in completely the wrong direction. By understanding these pitfalls and adopting a methodical approach to analysis, you’ll diagnose performance issues faster and with greater confidence.