Wait Statistics Monitoring WIth Database Health Monitor

What is Wait Statistics Monitoring in SQL Server?
SQL Server performance tuning can often feel like solving a complex puzzle, with countless variables impacting how efficiently your database operates. One of the most critical pieces of this puzzle is understanding what your server is waiting on—those moments when tasks are delayed due to resource contention or bottlenecks. This is where wait statistics monitoring comes into play, offering a window into the inner workings of SQL Server and revealing the root causes of performance issues.
Wait statistics provide detailed insights into why SQL Server tasks are not executing immediately, whether they’re waiting for CPU time, disk I/O, memory, or locks. By analyzing these wait types, database administrators can pinpoint specific areas of concern and take targeted action to improve performance. Fortunately, tools like Database Health Monitor simplify this process, making it easier to track and interpret wait statistics without getting lost in raw data or complex queries.
In this post, we’ll explore the fundamentals of wait statistics monitoring in SQL Server, including common wait types and their implications. We’ll also dive into how Database Health Monitor, a powerful and free performance monitoring tool, can help you identify and resolve wait-related bottlenecks with ease. Whether you’re a seasoned DBA or just starting out, understanding wait statistics is a game-changer for maintaining a healthy and efficient database environment.
For more information on Database Health Monitor you can visit StedmanSolutions.com. You can download the free trial of Database Health Monitor at https://DatabaseHealth.com/download2.
For example, common wait types include:
- CXPACKET: Related to parallelism and often signals suboptimal query plans or misconfigured parallelism settings.
- PAGEIOLATCH: Indicates slow I/O performance, where SQL Server is waiting on disk to retrieve or write data.
- LCK_M: Occurs when tasks are waiting on locks, which could point to contention issues between queries or processes.
By monitoring wait statistics, you can understand:
- Where the bottlenecks are (CPU, memory, I/O, locks, etc.).
- What types of waits are most frequent and causing the most delays.
- How to prioritize tuning efforts to address the root causes of these waits.
How Database Health Monitor Helps
Database Health Monitor is a free SQL Server Performance monitoring tool designed to make wait statistics monitoring much easier and more insightful. Here’s how it can help with Wait Statistics:
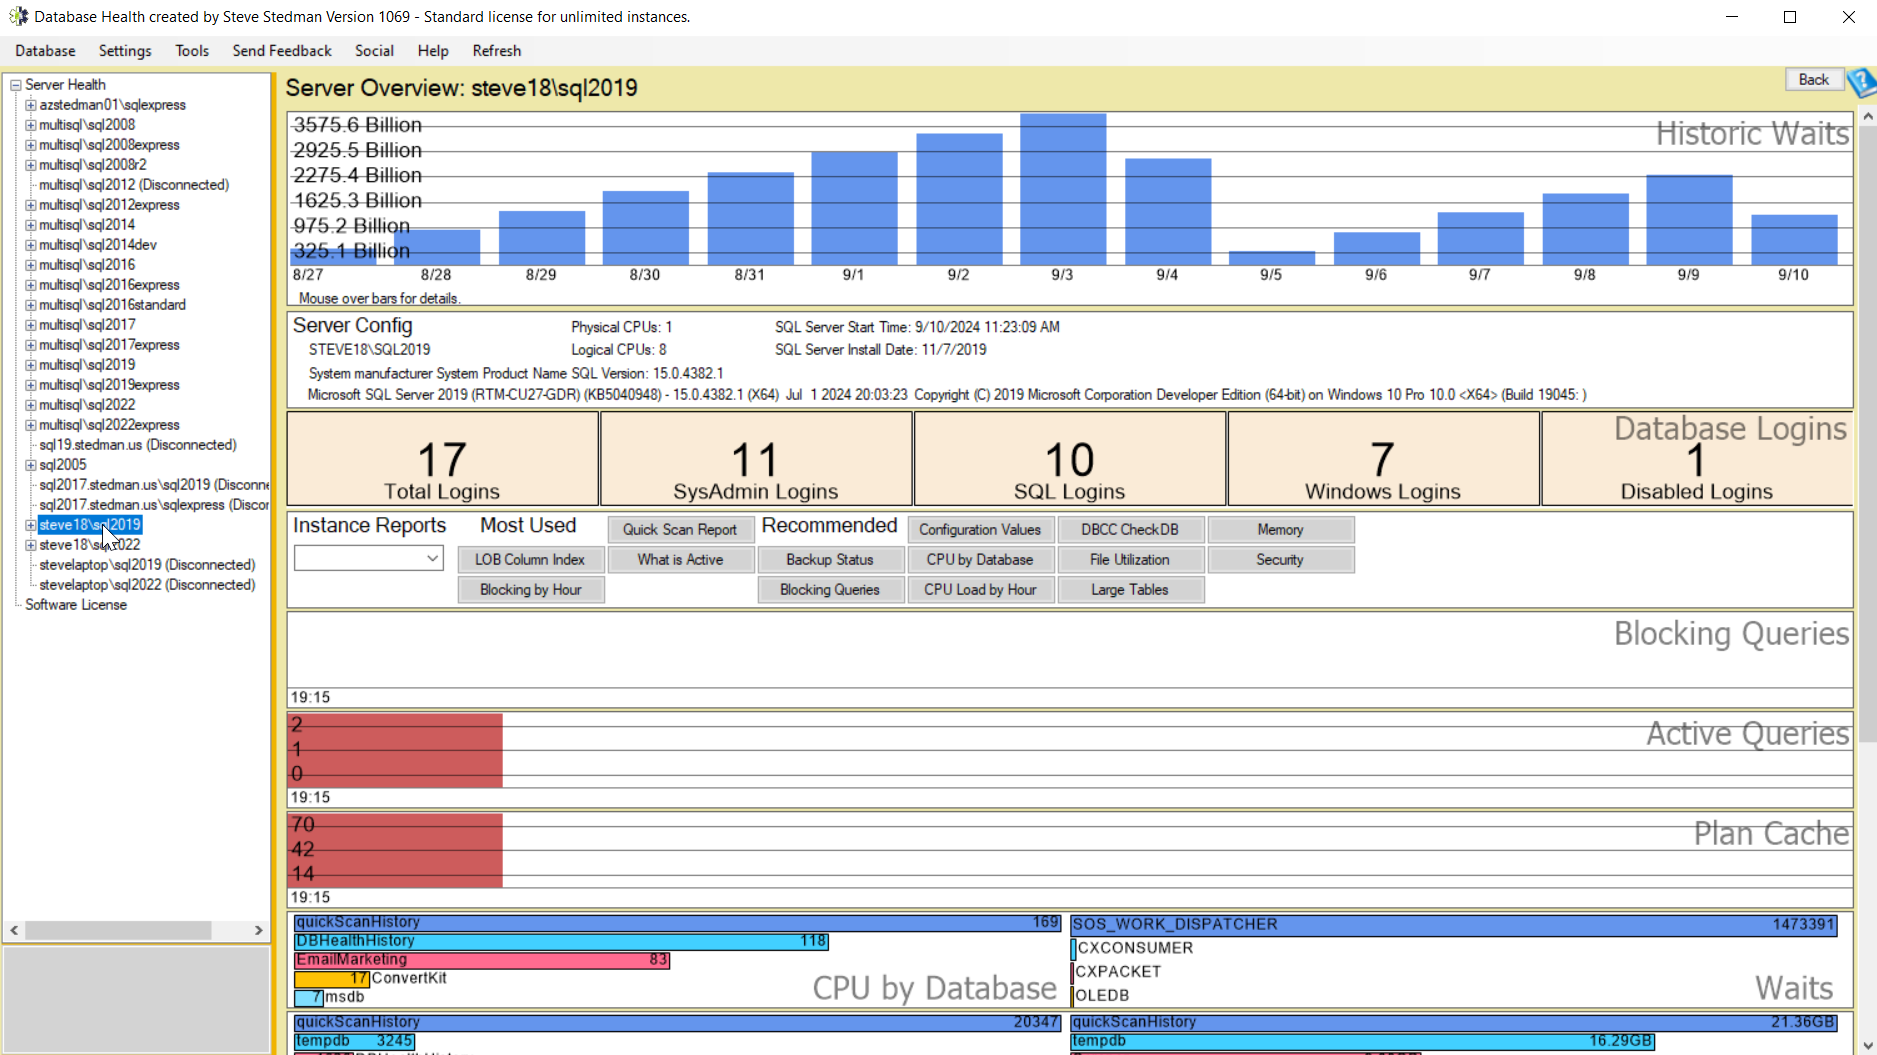
- Real-Time Monitoring: Database Health Monitor provides real-time tracking of wait statistics, giving you a clear picture of which wait types are occurring and how frequently.
- Wait Statistics Report: The tool includes a detailed Waits by Wait Type report, which summarizes the wait statistics across your SQL Server instances, allowing you to drill down into specific types of waits.

- Historical Data: Instead of just focusing on real-time data, Database Health Monitor also retains historical wait statistics, so you can track patterns and see how wait types change over time. This is useful for spotting trends or sudden changes in performance.
- Actionable Insights: The tool doesn’t just show the data—it helps you interpret it by highlighting high-impact wait types and offering suggestions for tuning, such as adjusting memory, tweaking parallelism settings, or optimizing disk performance.
- Integrated Alerts: With continuous monitoring, Database Health Monitor can be set up to alert you when certain thresholds of wait types are exceeded, allowing for proactive tuning before performance degrades significantly.
If you want to get started with monitoring wait statistics more effectively, you can download Database Health Monitor here and use it to uncover and resolve performance bottlenecks related to waits.
Need some help with Database Health Monitor. Check out our classes where you can learn all about Database Health Monitor.
For over 14 years, Database Health Monitor has been meticulously developed to deliver unparalleled performance and reliability for your database systems. Now is the perfect time to harness the full potential of this powerful application, designed to streamline monitoring, enhance efficiency, and ensure your databases run at their best. With its robust features and user-friendly interface, Database Health Monitor empowers you to take control of your database health like never before. Don’t wait— download it today and experience the difference a top-tier monitoring solution can make for your business or projects!
Thanks and have a great day!
Steve Stedman
Founder/Owner — Stedman Solutions, LLC.
SQL Server DBA Services![]()
Looking to schedule a meeting with me? Here is my availability: https://Stedman.us/schedule