Stedman SQL Server Podcast Episode 6: Latest Database Health Monitor Features & Fixes
Welcome to a deep dive into Episode 6 of the Stedman SQL Server Podcast, where we unpack the latest enhancements to Download Database Health Monitor Tool , a vital tool for SQL Server users seeking to optimize performance and reliability. This episode is packed with insights on new features and critical fixes that make Database Health Monitor an even more indispensable part of your database management arsenal. Whether you’re a seasoned DBA or just starting out, there’s something valuable for everyone in this update.
For those unfamiliar, Database Health Monitor is a free, user-friendly solution developed to streamline the monitoring and troubleshooting of SQL Server environments. In this podcast episode, we spotlight how recent updates empower administrators with sharper diagnostics and more robust monitoring capabilities. Join us as we explore what’s new and improved in this powerful tool.
From expanded documentation to real-time performance charts, Episode 6 covers a range of updates designed to tackle common SQL Server challenges head-on. We’ll also touch on key bug fixes that ensure a smoother, more reliable user experience. Let’s jump into the details of how these changes can elevate your database management game.
Exploring Episode 6 of the Stedman SQL Server Podcast: New Features in Database Health Monitor
In Episode 6 of the Stedman SQL Server Podcast, we took a closer look at the latest updates to Database Health Monitor (DBHM), a free tool designed to give SQL Server users clear insights into performance, reliability, and potential issues. We’re excited to cover several new features and bug fixes in this episode that enhance DBHM’s functionality, provide better diagnostics, and add even more monitoring power to your SQL Server toolkit.
For anyone not familiar, Database Health Monitor is a SQL Server monitoring tool I created to simplify the day-to-day tasks of SQL Server administrators. Let’s dive into the updates covered in Episode 6, focusing on new features and key bug fixes!
Bug Fixes in Database Health Monitor
In every release, we address issues to ensure a smooth user experience, and this latest version is no exception. Here are two critical fixes highlighted:
- Old Icon in Historic Waits Advisor Dialogs: We corrected an outdated icon in the Historic Waits Advisor, providing a cleaner, updated interface for diagnosing wait issues.
- Error in Quickscan Check 227: Quickscan Check 227, designed to catch potential database health issues, had an error that is now resolved, ensuring reliable diagnostics.
New Features in Database Health Monitor
Several powerful new features were introduced in this release, and we showcased how they enhance your SQL Server monitoring and troubleshooting capabilities.
1. Expanded Documentation on Wait Types in the Historic Waits Advisor
The Historic Waits Advisor now includes more documentation for common wait types. Understanding what is causing delays or blocking can be crucial, and these additions make it even easier to identify root causes for slowdowns:
- PREEMPTIVE_OS_PIPEOPS: Indicates waits related to OS-level pipe operations.
- PREEMPTIVE_OS_QUERYREGISTRY: A wait type often seen with registry-related operations.
- PAGELATCH_EX: Common with in-memory pages, especially in high concurrency environments.
2. Real-Time Overview at the Database Level
In the Real-Time Overview, two new charts at the database level give a more dynamic view into ongoing performance issues:
- Blocking Queries Chart: This chart shows current blocking sessions, allowing you to instantly understand if blocking is an issue. Clicking on the chart takes you to the detailed Database Level Blocking Real-Time page, where you can analyze and address blocking in real time.
- Active Queries Chart: This chart reveals currently active queries, giving a snapshot of database activity. A click on this chart takes you to the Database Level Active Queries Real-Time page for deeper investigation into active workload.
3. Enhanced Quickscan Report Check 233
The Quickscan Report has been a core feature of Database Health Monitor, helping DBAs spot configuration and performance issues. This new check, Quickscan Report Check 233, identifies SQL Server Agent jobs that have been configured but not scheduled. Detecting such jobs can prevent missed processes or unexpected maintenance gaps.
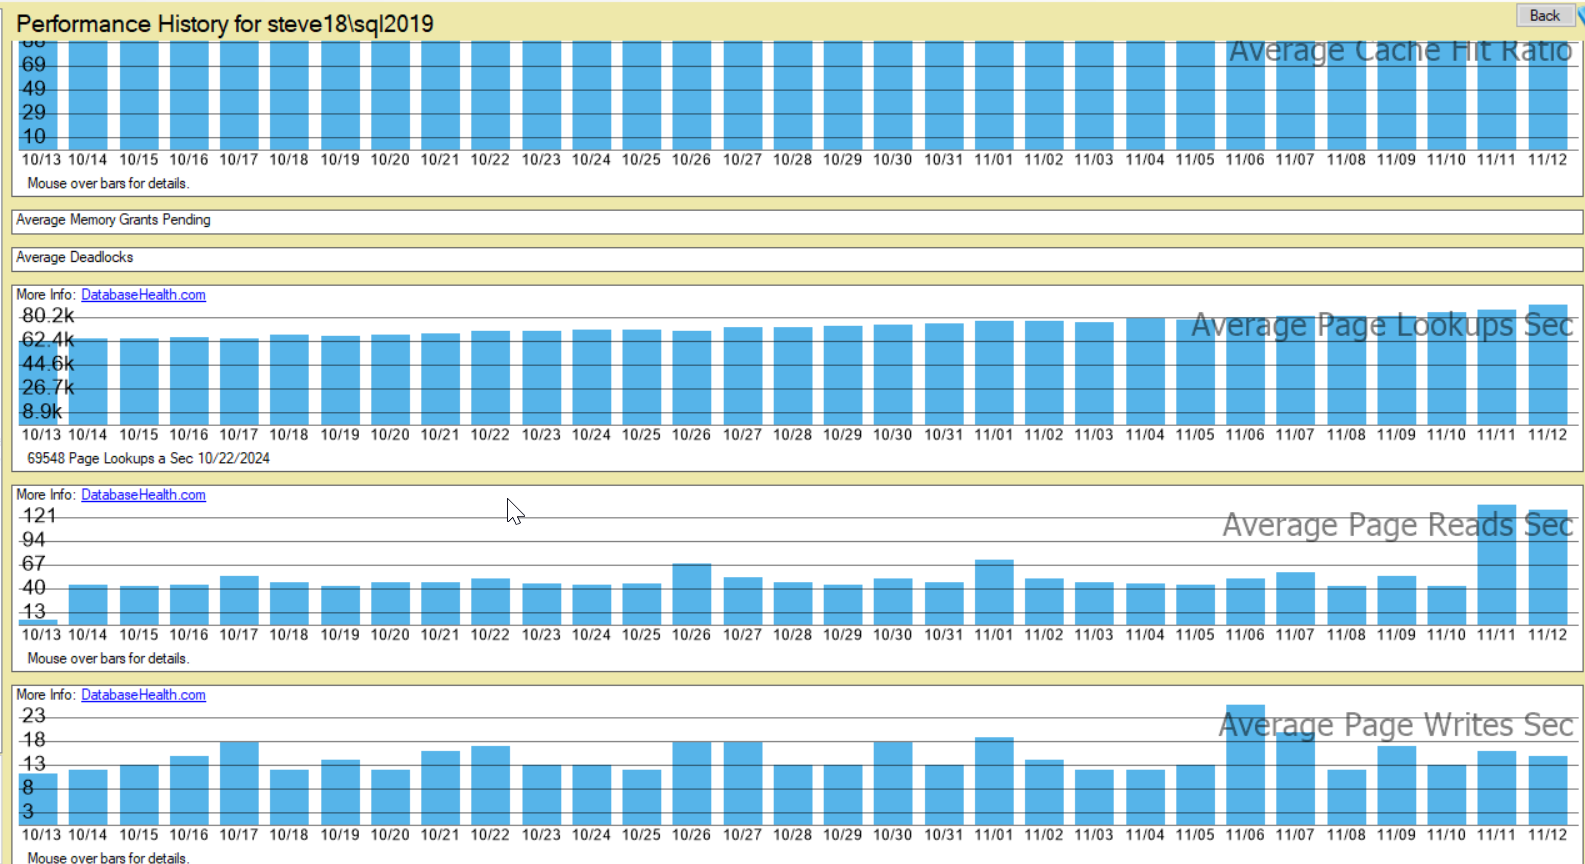
4. Instance Report – “Performance History”
The new Performance History report offers a big-picture view of performance trends over time. From this single report, you can track metrics that reveal performance changes and diagnose possible causes over longer time frames.
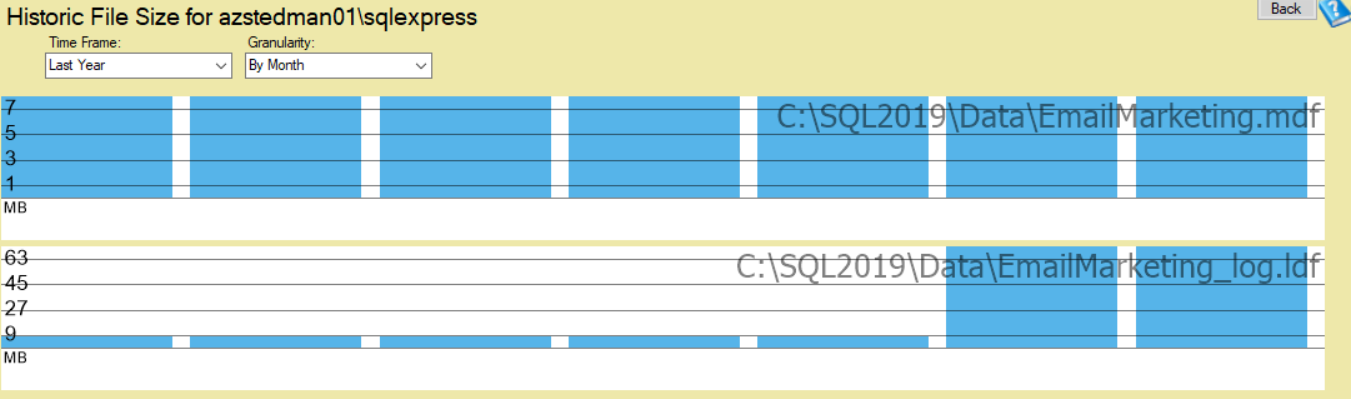
5. Historic Report – “File Size Over Time”
Monitoring file growth is essential for capacity planning and to prevent issues related to disk space. The new File Size Over Time report, available on the Server Tree’s Historic Reports, provides a detailed look at database file growth patterns. With this insight, you can identify trends and better manage storage allocation for your SQL Server instances.
Why Tune In?
If you’re managing SQL Server environments or looking for ways to optimize performance, these episodes offer practical guidance, from new tools to tips on getting the most out of Database Health Monitor. And remember, Stedman Solutions provides expert SQL Server Managed Services to help you with everything from Performance Tuning to ongoing monitoring and issue resolution.
If you’re interested in learning more, check out Episode 6 on the Stedman SQL Server Podcast, and explore how Database Health Monitor can enhance your SQL Server environment.
Stay tuned for more episodes as we dive deeper into SQL Server best practices, tools, and tips!
Summary for Database Health Monitor Updates
- Latest enhancements in Database Health Monitor (DBHM) from Stedman SQL Server Podcast Episode 6.
- New real-time performance charts for blocking and active queries at the database level.
- Expanded documentation on wait types in Historic Waits Advisor for better diagnostics.
- Introduction of Performance History report for tracking long-term performance trends.
- Addition of File Size Over Time report for monitoring database file growth patterns.
- Enhanced Quickscan Report Check 233 for identifying unscheduled SQL Server Agent jobs.
- Critical bug fixes including outdated icon in Historic Waits Advisor and error in Quickscan Check 227.