SQL Server Health Monitoring: Best Practices and Essential Tools

How to Monitor SQL Server Health: Best Practices and Tools
Ensuring the health of your SQL Server is a cornerstone of maintaining robust database performance and preventing costly disruptions. Without proper monitoring, minor issues can escalate into major problems, such as performance bottlenecks or data loss, that impact your business operations. In this post, we’ll explore the best practices and essential tools to help you keep your SQL Server running smoothly and efficiently.
The importance of proactive monitoring cannot be overstated when it comes to SQL Server management. It’s not just about reacting to problems as they arise, but about anticipating potential risks and addressing them before they affect your system. From tracking key performance metrics to identifying early signs of trouble, a well-structured monitoring approach can save time, resources, and stress.
Diving into SQL Server health monitoring, we’ll cover critical areas such as performance metrics, common pitfalls to avoid, and the tools that can simplify the process. Whether you’re a seasoned DBA or new to database administration, understanding these fundamentals will empower you to maintain a stable and secure environment. Let’s get started with the strategies and solutions that can make a real difference.
Why SQL Server Monitoring Is Critical
SQL Server monitoring isn’t just about checking a few metrics now and then; it’s about actively ensuring that your databases run optimally and stay available. Failing to monitor can result in:
- Performance Degradation: Slow-running queries, high CPU usage, and memory bottlenecks that impact user experience.
- Data Corruption: Issues like undetected page corruption or index fragmentation can grow worse over time.
- Unexpected Downtime: System failures or resource exhaustion can lead to outages, costing time, money, and reputation.
- Security Risks: Unusual activities might go unnoticed without real-time monitoring.
Key Metrics to Monitor in SQL Server
When it comes to SQL Server health, some specific metrics offer valuable insights into the state of your database:
- CPU and Memory Usage: Track CPU utilization over time to spot trends and peaks. Monitor SQL Server memory usage (buffer cache, plan cache, etc.) to ensure memory is being used efficiently.
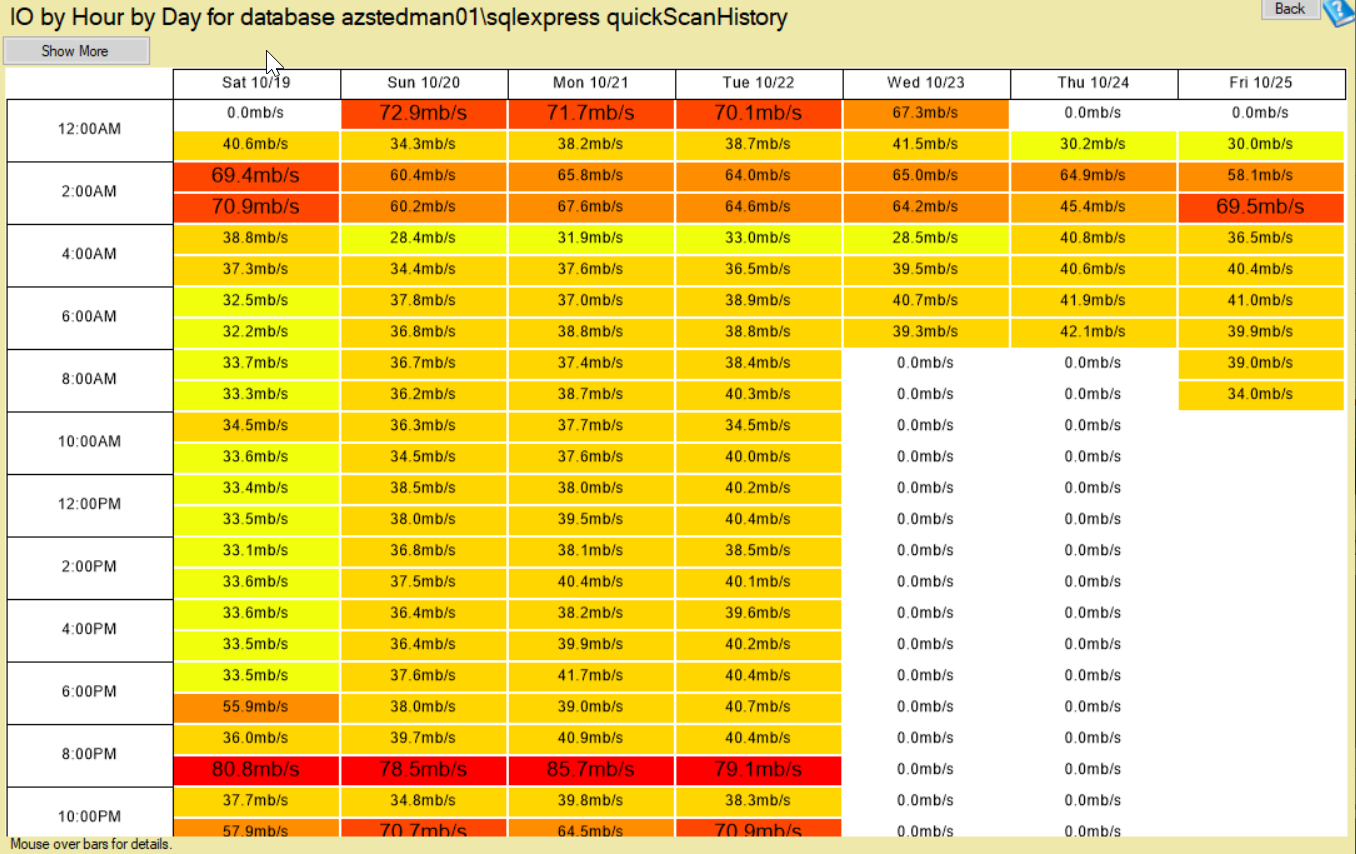
- Disk I/O: SQL Server is highly I/O-bound. Measure read/write latency, throughput, and I/O stall times to identify potential bottlenecks.
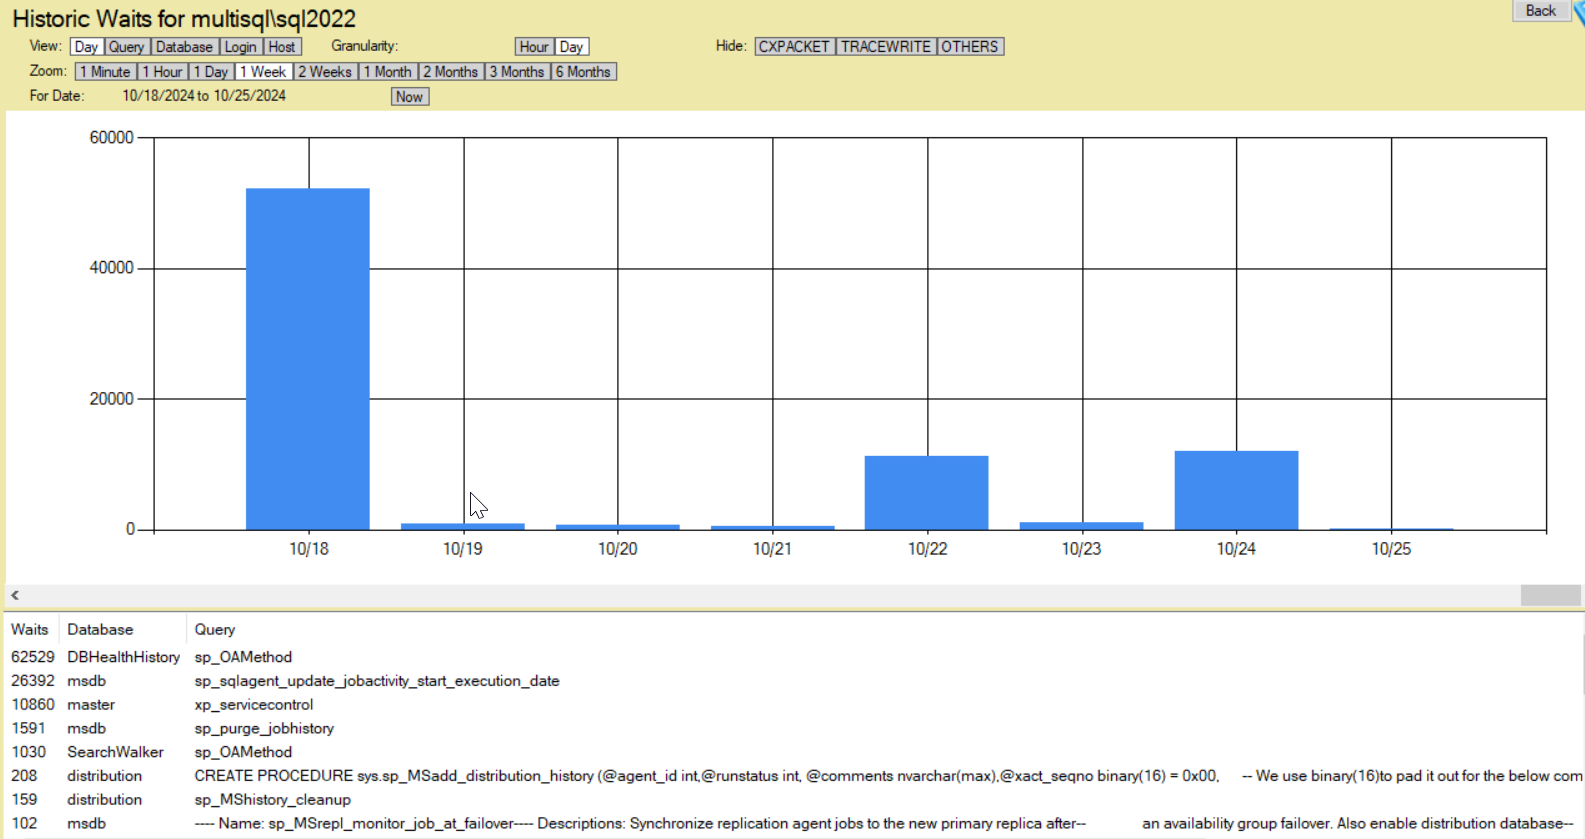
- Wait Statistics: SQL Server wait stats reveal what processes are waiting on—e.g., CPU, disk, or locks. High waits in specific categories can pinpoint the root causes of slow performance.
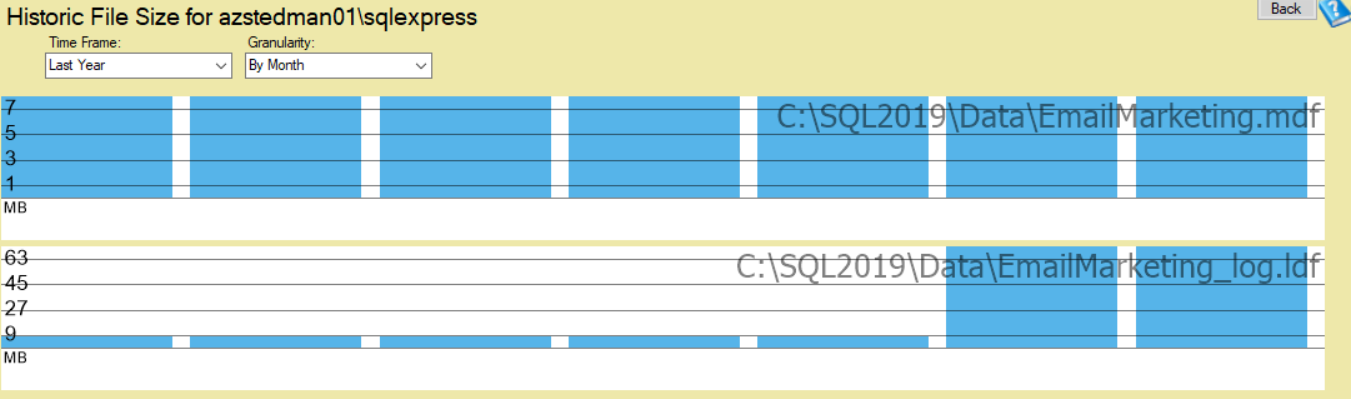
- Database Size & Growth: Watch database growth to prevent storage-related issues. Monitor space allocation for data files, log files, and tempdb.
- Blocking and Deadlocks: Blocking occurs when processes wait for resources held by other processes. Deadlocks happen when two processes block each other completely. Monitoring these helps to maintain query performance and prevent bottlenecks.

- SQL Agent Jobs & BACKUP Status: Regularly verify that all SQL Agent jobs are running as scheduled and that backups are completing without errors.
- Errors and Alerts: Keep an eye on error logs for messages related to connectivity, corruption, security, and hardware failures.
- Database Corruption Checks: Run
DBCC CHECKDBregularly to identify and repair corruption issues before they spread.
Best Practices for SQL Server Monitoring
- Implement Continuous Monitoring: Use a monitoring tool to get real-time alerts and notifications. Continuous monitoring is crucial for early detection and resolution of performance and stability issues.
- Set Up Alerts and Notifications: Configure alerts for high-severity events such as long-running queries, failed backups, and system errors. Use email, SMS, or other methods to notify DBAs promptly.
- Track Trends Over Time: Short-term spikes can sometimes be misleading. Analyzing metrics over time allows you to identify trends and proactively address issues like growing database sizes, increasing CPU usage, or creeping I/O latency.
- Automate Database Maintenance: Automate common maintenance tasks like index rebuilds, statistics updates, and integrity checks. Automated maintenance helps prevent performance degradation and keeps your database optimized.
- Review Wait Stats Regularly: Wait stats provide insights into what’s slowing down SQL Server the most. Regular review of these stats is essential for identifying and troubleshooting performance bottlenecks.
- Monitor TempDB: TempDB is a global resource and can be a common source of contention. Monitor its usage, file configuration, and space allocation to avoid performance hiccups.
- Keep an Eye on Security: Monitor logins, failed login attempts, and permissions to ensure your database remains secure and compliant.
Tools for Monitoring SQL Server Health
1. Database Health Monitor
Database Health Monitor is a powerful tool designed specifically for SQL Server monitoring. It tracks performance, integrity, and overall health through intuitive dashboards, alerting, and diagnostic features. While it is not free, it is affordable, making it an excellent choice for identifying potential problems before they escalate.
2. SQL Server Management Studio (SSMS)
SSMS provides built-in monitoring features, including Activity Monitor, performance reports, and execution plans. While helpful, SSMS lacks real-time alerting and historical analysis, making it more suited for spot checks.
3. SQL Server Extended Events
Extended Events is a lightweight performance monitoring system built into SQL Server. It offers detailed data on events like query executions, lock waits, and deadlocks.
4. SQL Server Profiler
Though it’s a legacy tool, SQL Server Profiler can still be useful for tracing and debugging specific issues. However, it is not recommended for continuous monitoring due to performance overhead.
How Stedman Solutions Can Help
SQL Server monitoring can be a time-consuming and challenging task, especially if you’re managing a busy environment with multiple instances. That’s where Stedman Solutions‘ Managed Services come in:
- Expert DBAs: Get 24/7 monitoring by experienced, US-based SQL Server specialists.
- Advanced Tools: We leverage Database Health Monitor and other tools to provide continuous, proactive monitoring.
- Immediate Action: When an issue arises, Our Team acts quickly to resolve it before it impacts your business.
- Knowledge Sharing: Beyond monitoring, we offer Mentoring and knowledge transfer, helping you better understand your SQL Server environment.
Conclusion
Monitoring SQL Server health is not just a task but a necessity for keeping your databases secure, efficient, and reliable. Implementing best practices and using the right tools—like Database Health Monitor—can help you stay ahead of potential issues. For businesses looking for hands-on expertise and comprehensive support, consider Stedman Solutions’ Managed Services to ensure your SQL Server remains at peak performance.
If you have any questions or need guidance on SQL Server monitoring, don’t hesitate to contact us. Let’s keep your SQL Server healthy and running smoothly!
Need some help with Database Health Monitor. Check out our classes where you can learn all about Database Health Monitor.
For over 14 years, Database Health Monitor has been meticulously developed to deliver unparalleled performance and reliability for your database systems. Now is the perfect time to harness the full potential of this powerful application, designed to streamline monitoring, enhance efficiency, and ensure your databases run at their best. With its robust features and user-friendly interface, Database Health Monitor empowers you to take control of your database health like never before. Don’t wait— download it today and experience the difference a top-tier monitoring solution can make for your business or projects!