SQL Server Job Slow When Others Run? Here’s Why
Everyone has watched a job slow when others run alongside it. An SSIS package that finishes in four minutes at nine in the morning can take forty at two, when five other jobs kick off on the same schedule. Nothing fails. Nothing logs an error. The history just shows a run that took ten times longer than usual, and whoever's on call assumes the package itself got worse, maybe blames a bad plan, and moves on none the wiser.
Why is my SQL Server job slow when others run at the same time? A job slow when others run is not the job's own fault. SQL Server Agent gives each subsystem a limited pool of worker threads, tracked in syssubsystems as max_worker_threads. When that pool fills up, a step waits instead of failing, and the wait counts inside the job's duration, making a healthy package look like it slowed down.
The instinct is to open the package and start tuning it: look for a slow lookup, check the data flow, maybe rebuild an index on the destination table. None of that touches the real problem, because the package didn't get slower. It spent thirty-six minutes waiting for a worker thread that five other jobs already had, and no amount of tuning inside the package changes how many threads are free outside it. Database Health Monitor's Subsystem Load report exists to show that wait instead of letting it hide inside a duration number.
What Makes a Job Slow When Others Run
Each job step is tied to one subsystem: T-SQL, CmdExec, PowerShell, SSIS, ActiveX, replication, or Analysis Services. On most instances the bulk of the steps are T-SQL or CmdExec, with SSIS and PowerShell picking up whatever the ETL and maintenance work needs. Every subsystem except T-SQL runs its steps through a pool of worker threads, and Agent tracks the size of that pool in syssubsystems, in a column called max_worker_threads. A step that shows up while the pool is already full doesn't fail, and it doesn't raise a warning either. It just waits, and every minute of that wait becomes part of the job's own duration, which is why the package looks slow instead of stuck.
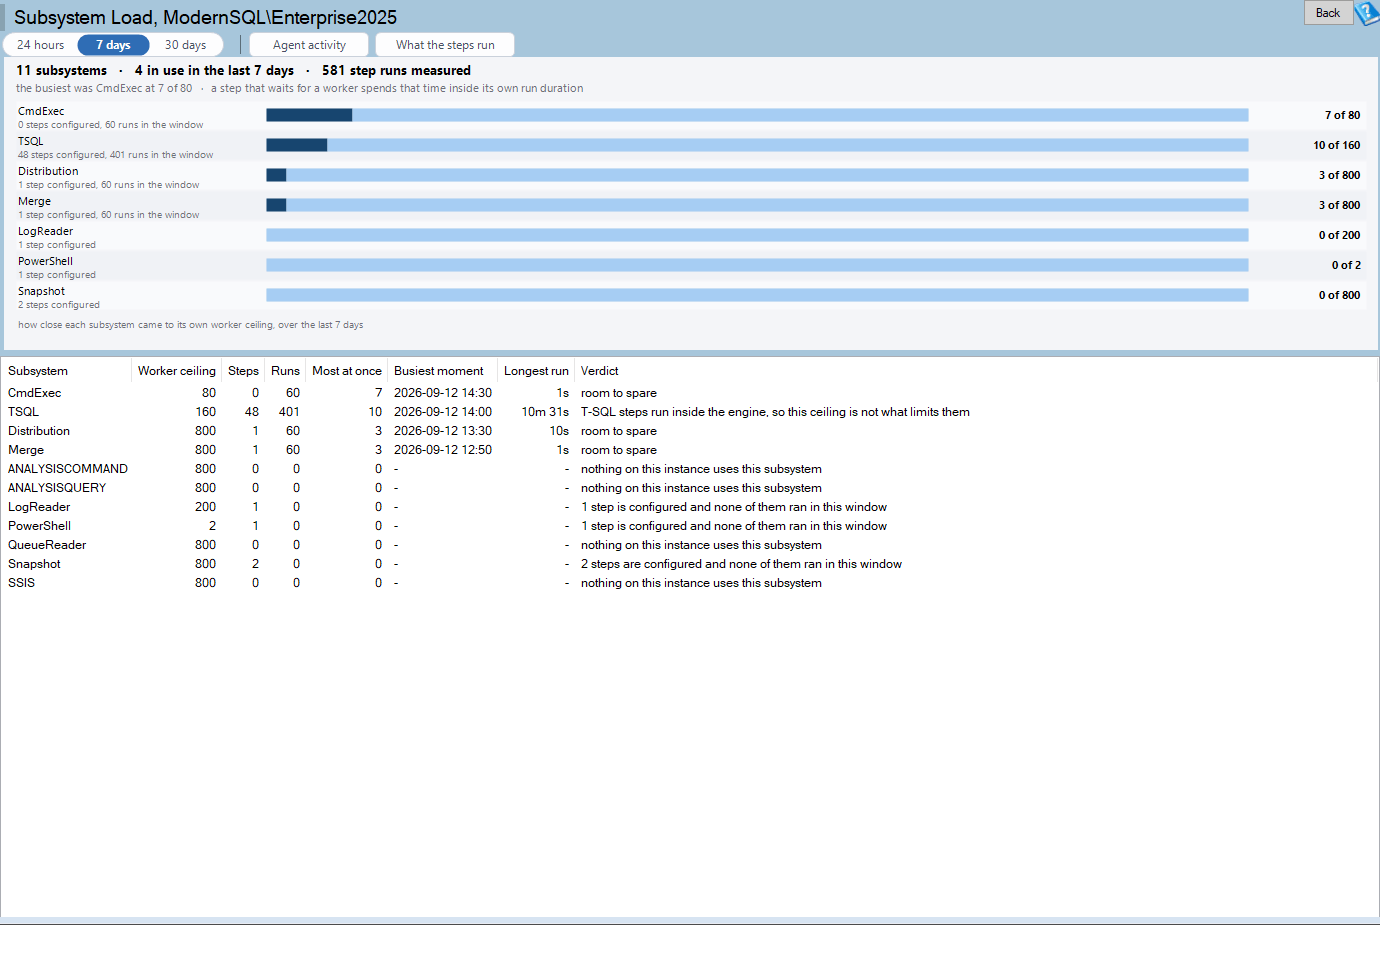
Subsystem Load is one of the reports in Database Health Monitor. It runs against your own servers, and it takes about a minute to have this same screen open on one of them.
How the Report Works Out the Overlap
msdb doesn't store how many steps were running at once. It only records when each step started and how long it ran, in sysjobhistory, as run_date, run_time, and run_duration: three integers holding yyyymmdd, hhmmss, and hhmmss. The report walks every run in the window you pick, either 24 hours, 7 days, or 30 days, and works out how many steps overlapped at any given instant. It then reports the busiest moment it found for each subsystem, right next to the ceiling from syssubsystems, defaulting to a 7 day window so one quiet night doesn't hide a pattern that only shows up over a week.
The T-SQL Exception
T-SQL steps don't go through a subsystem worker pool at all; they execute directly inside the engine, so the worker ceiling simply doesn't apply to them the way it does to CmdExec or SSIS steps. The report still lists T-SQL's step count and run count. It just leaves off the ceiling bar, which beats flashing a scary red bar on every single instance for something that was never actually the bottleneck there, and that distinction matters if you're scanning a dozen servers and don't want to chase a false alarm.
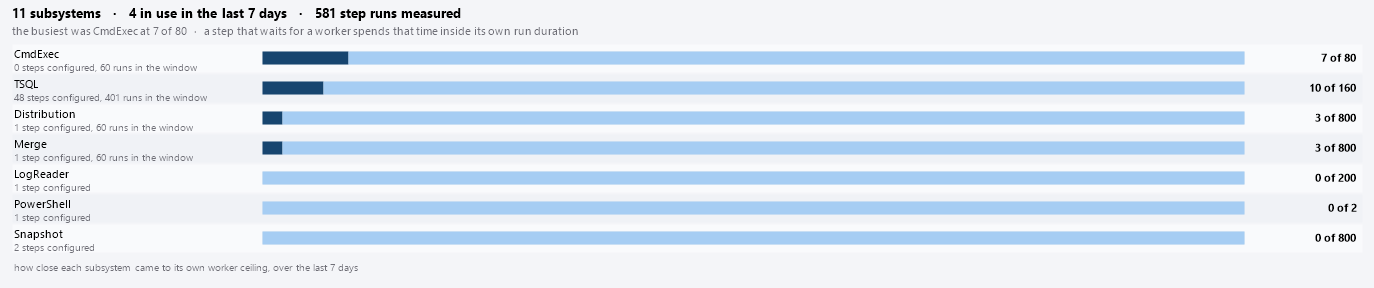
syssubsystems; the darker fill marks the highest overlap the walk actually found.Reading the Grid
The grid underneath the chart puts a number on everything the bars show: how many steps use each subsystem, how many of them actually ran in the window, and the longest single run recorded for it. For the full column reference, the Subsystem Load documentation page covers every field, including the ones this post skips.

| Column | What it tells you |
|---|---|
| Worker ceiling | max_worker_threads from syssubsystems; blank for T-SQL |
| Most at once | The peak overlap the walk detected for that subsystem, the number worth checking against the ceiling |
| Busiest moment | When that peak overlap occurred, so it can be lined up against the job schedule |
| Longest run | The single longest step of that subsystem seen in the window |
| Verdict | Whether that subsystem is pegged at its ceiling, getting close, or has plenty of headroom |
Why Most At Once Might Look Low
Agent doesn't keep sysjobhistory forever. It trims the table down to a row count instead of a time span, and a busy instance sitting at the default limit can hold far less than the seven days this report is set to look at. If Most at once reads lower than you'd expect, that's usually why: the walk that counts overlapping steps can only see the runs still sitting in sysjobhistory. Agent Settings is where that row limit lives, worth checking before you trust a low number on a server running a lot of jobs.
Can You Just Raise the Ceiling?
max_worker_threads in syssubsystems is a normal column, and you can update it. Doing that moves the contention somewhere else instead of removing it, since the machine still has the same number of cores underneath every pool. Staggering the schedule so six packages don't start on the same minute is usually the cheaper fix, and it's also the one that doesn't need a restart. Once you've found the subsystem that's pegged, Agent Activity shows which jobs were actually running at that busiest moment, and Job Commands shows what those steps run, so you know exactly what you're rescheduling. If this is the first time a report has shown you a cost that was hiding in plain sight, SQL Server Technical Debt: Where to Start Fixing It is a good next stop, since it covers the same kind of gap between what a server looks like it's doing and where the time actually goes.
What to check on your own server
- Check
max_worker_threadsfor each row inmsdb.dbo.syssubsystemsto see the real worker ceiling on this instance - Pull
sysjobhistoryfor a job that only runs long some days and compare it against what else was scheduled then - Check Agent's job history retention setting, since a busy instance can trim
sysjobhistoryto less history than the window you want - Stagger schedules so packages using the same subsystem don't all start on the same minute
Try Database Health Monitor Today
It replaces guessing about which Agent subsystem is queueing job steps with a direct comparison against the worker thread ceiling that is actually causing the wait. Database Health Monitor shows it on every instance you connect, in the time it takes to open the report.
Download Database Health Monitor and run the Subsystem Load report against your own server. There is nothing to configure first, and you will know inside a few minutes whether it tells you something you did not already know.
Related reading: master Backup Out of Date? Here's How to Check It. A companion piece looks at why a master backup that ran successfully every night can still be missing logins, role grants, and linked servers created since, and how to see that gap in one glance instead of subtracting dates by hand.
Related reading: Is This Query Slower Than Normal? Ask Its Own History. A look at how per-query control limits built from Query Store history separate a real slowdown from a query's ordinary wobble, and what to check once one is flagged.