Silent Job Failure: Read Missed Runs in This Order
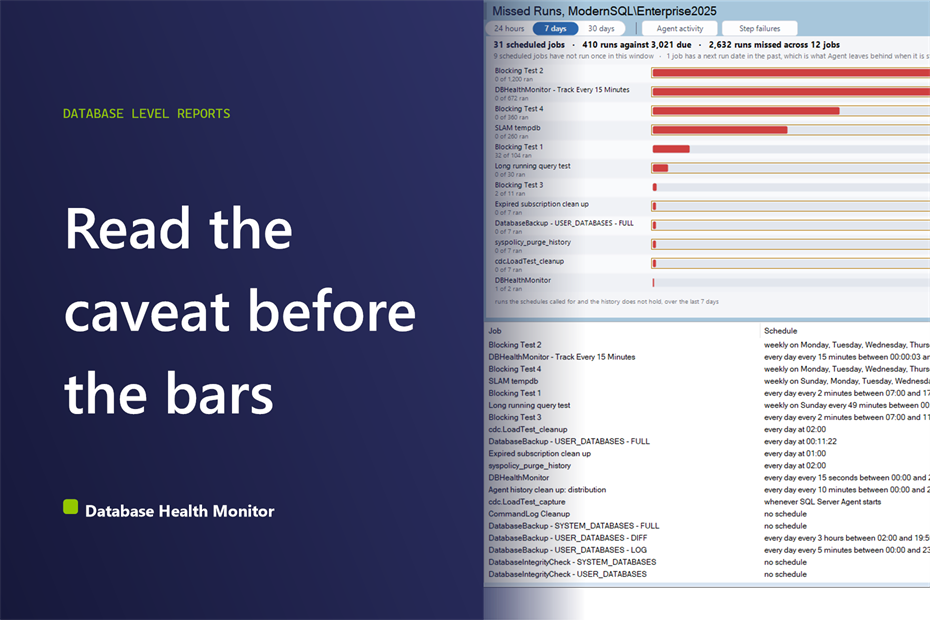
You open the Missed Runs report and the first thing on screen is a large number: 2,632 runs missed across twelve jobs. Do you panic? Not yet. A silent job failure leaves no history row to filter on, so Database Health Monitor works it out by counting twice. That count only means something once you read the screen in the right order.
How do I find a silent job failure in SQL Server Agent? To find a silent job failure in SQL Server Agent, compare the runs each schedule should have produced against the runs sysjobhistory actually holds. Read the caveat line first, then Schedule, Due, Ran, Next run and Verdict. A disabled schedule, a Next run in the past, or Agent downtime explains most gaps.
In this post
- Start with the caveat line, not the biggest number
- Schedule comes before Due
- Due against Ran: what healthy looks like
- Reading a silent job failure by its Next run
- Verdict sorts the gap into a cause
- Where the drill down leads
- Where to open it, and what an empty page means
Start with the caveat line, not the biggest number
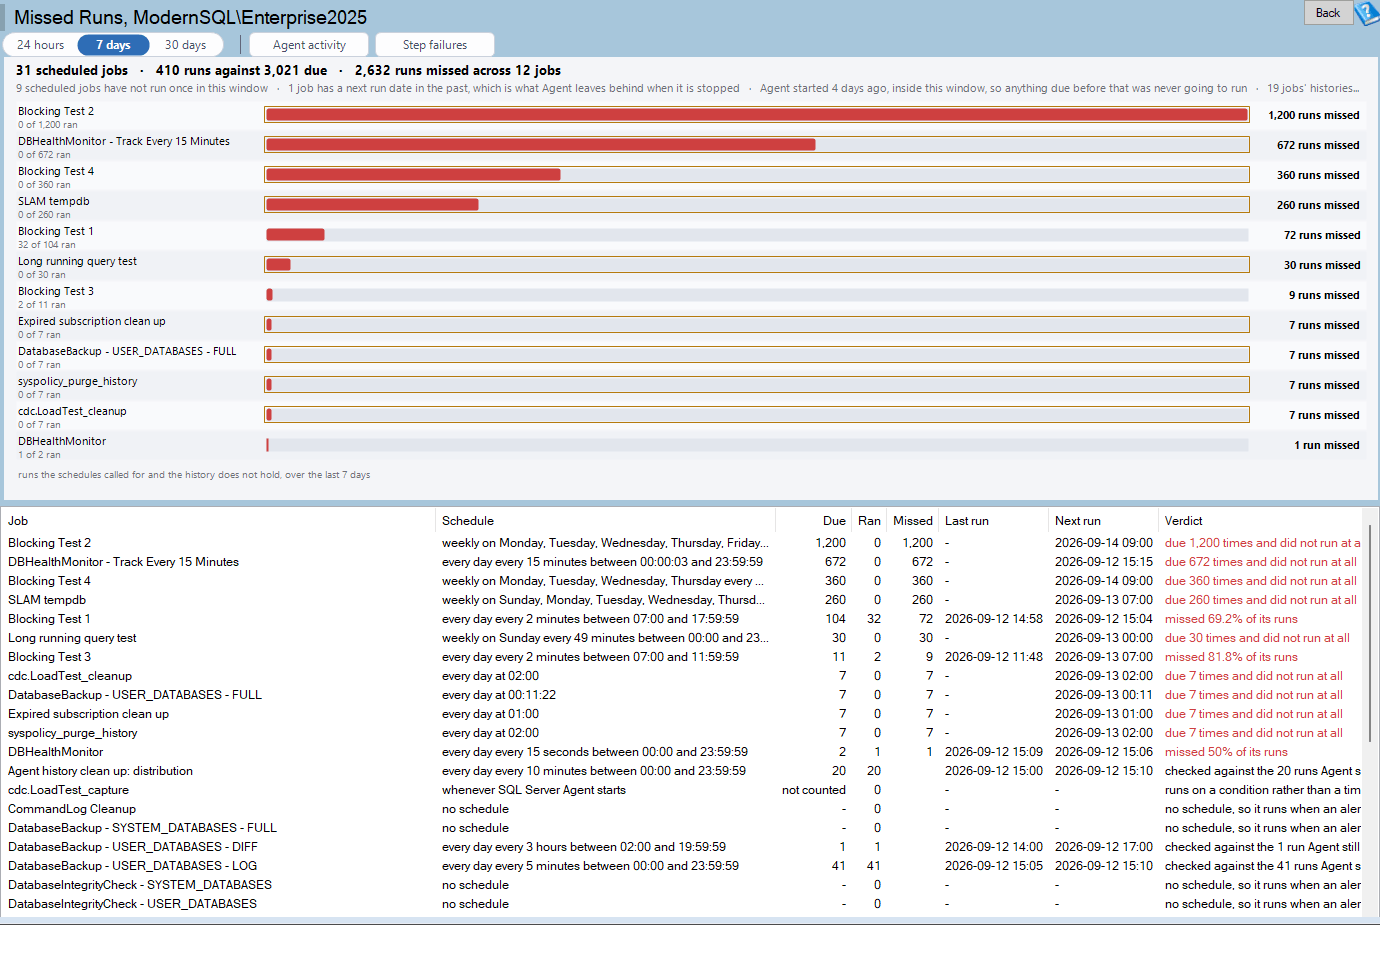
The page opens on a chart, and the chart opens on a sentence. Read the sentence before the bars. On the sample instance it says that Agent started four days into the seven day window. Anything due before that moment was never going to run, so the page declines to count it against the jobs.
That is why the headline total is the wrong place to begin. Missing 2,632 of 3,021 due runs sounds like a catastrophe. Some of it may be. Some of it is just a window that reaches back to a time when the service was not running. The caveat line tells you how much of the gap you are allowed to believe.
Missed Runs is one of the reports in Database Health Monitor. It runs against your own servers, and it takes about a minute to have this same screen open on one of them.
The caveat does a second job. Agent trims sysjobhistory to a row count, not to a date. When the oldest history inside your window is newer than the window itself, the line says so. The reason is simple: Ran will be short through no fault of the job, because the evidence was thrown away.
If you have been trimming history hard to keep the database small, that trade is worth a second look. msdb Is Too Big? Here's What's Actually Filling It covers where the space goes, and it is worth reading before you shorten anything that this report depends on.
Schedule comes before Due
Now the grid. The columns run Job, Schedule, Due, Ran, Missed, Last run, Next run and Verdict. Read them close to that order, but spend your first second on Schedule. It decides whether the numbers beside it are arithmetic or silence.
Schedule is written in words. Every day at 02:00. Every 15 minutes between 06:00 and 20:00. On Agent start. On idle. Or none. The first two kinds give Due a number. The others do not, and a blank there is deliberate.
Take the two that cannot be predicted. A job set to run when Agent starts has no times to calculate, because whether it fired depends on whether the service restarted. A job set to run when the instance goes idle fires on a CPU threshold held for a period, and that threshold lives in Agent Settings, not on a clock. Both are listed with their schedule described and no expectation set against them.
A job with no schedule is not a fault either. Plenty of jobs exist to be started by an alert, by another job, or by a person at a keyboard. The report lists them as exactly that. If you were hoping to find them flagged red, you will be disappointed, and you should be glad.
Due against Ran: what healthy looks like
The method is two counts, kept apart. Due is worked out from sysschedules: the runs the schedule implies inside the window. Ran is counted from sysjobhistory, using the job outcome rows. The report shows both beside each other instead of handing you a difference. You see 1,200 due and nothing ran, and you judge the claim yourself.
A healthy row is dull. Due and Ran agree, the Missed cell is empty or zero, Last run is recent, Next run is still ahead of you, and the verdict says the job is keeping up. On a calm instance the chart is nearly empty, because it draws one bar for each job that has a gap and no others.
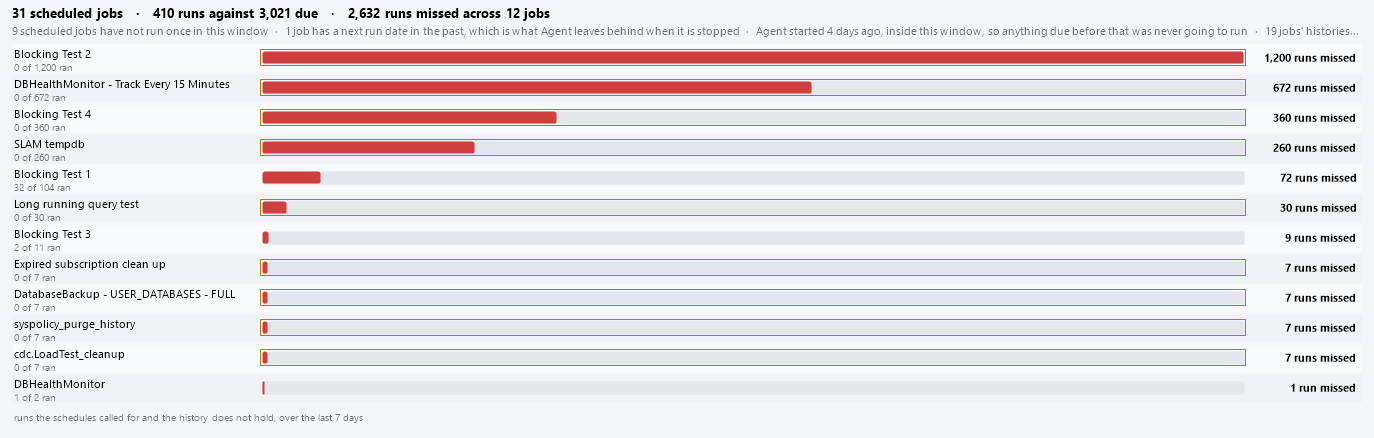
The chart earns its place by ranking. The top bar is the job whose schedule asked for the most runs that the history cannot show. That is a better starting point than the job list, where an enabled job looks healthy whether or not it has run this week.
Reading a silent job failure by its Next run
Next run is what Agent believes is coming. Agent recomputes next_run_date when it processes the schedule. A date in the past means that processing has not happened, and that usually means the service was down at the moment the run was due.
Treat a past Next run as its own finding, even when the Missed figure looks small. A job can be only a few runs behind and still be stuck, waiting for a moment that has already gone by. Put it beside Last run. An old Last run and a Next run in the past tell a consistent story. A recent Last run with a past Next run deserves a closer look.

The layout is built so you do not scroll sideways. Job and Schedule are capped at 180 and 170 pixels, the number and date columns fit their text, and Verdict takes the remaining width, never less than 300 pixels. A name that is still cut off shows in full, with its verdict, in the tooltip when the mouse rests on the row.
Verdict sorts the gap into a cause
The last column is where the report commits. A verdict says that the job is keeping up, that its schedule is disabled, or that the history is too short to say. Those three phrases cover most of what you will find, and they point at different fixes.
| What you see | Likely cause | Where to look next |
|---|---|---|
| Due is high, Ran is low, Agent was up the whole time | The job is enabled but its schedule is disabled | Job Schedules |
| Next run in the past, Last run old | Agent was down when the run came due | Agent Activity |
| Ran is short and the caveat line mentions history | Job history was trimmed inside your window | Agent Settings, the row limit |
| Missed is blank | On Agent start, on idle, or no schedule at all | Nothing to fix |
The disabled schedule case is the one that surprises people. An enabled job with a disabled schedule attached runs nothing while looking healthy in the job list. Nothing fails, so nothing is written, and the job list has no column that would tell you.
The history case is the one that wastes an afternoon. If Ran is lower than Due and the caveat line points at trimmed history, nothing is wrong with the job. Raise the limit in Agent Settings and give it time to fill, or you will chase ghosts.
Where the drill down leads
Click a bar and the grid selects that job's row. Double click it and you land in Agent Activity, which shows the runs of every job over its own window. That is the page you want next, because it answers the question this report cannot: was Agent up when these runs were due? The holes in the Agent lane are the explanation.
Right click a bar for the grid's menu on that job. It offers Copy what this job's schedule says, Copy job name and What Agent has been doing. Right click an empty part of the chart and the chart itself goes to the clipboard, ready for a ticket.
The toolbar has three controls worth knowing. Window offers 24 hours, 7 days and 30 days, with 7 days as the default. Use 24 hours when you are chasing something that just happened, and move to 30 days once you trust the caveat line. Agent activity opens the page above. Step failures opens Job Step Failures, which covers the opposite problem: runs that did happen and went wrong.
Put the two halves together and you have the whole picture. Failed Jobs and Job Step Failures show the jobs that failed loudly. Missed Runs shows the ones that never started. Job Schedules lists the schedules themselves when you need to change one.
Where to open it, and what an empty page means
Expand a server in the tree, expand the msdb database, then open MSDB, Missed Runs. The report appears only on an instance that can have SQL Server Agent. It reads sysschedules, sysjobschedules, sysjobs and sysjobhistory, which is why the msdb database is where it lives.
One message deserves a warning. If the page says there are no jobs on this instance, and you know the instance runs jobs, the cause is the login. It cannot see them. That is a permissions problem and not good news.
The full column reference, including the data sources, is on the Missed Runs documentation page. Open the report against the busiest instance you own, and look at the caveat line first.
What to check on your own server
- Note when the SQL Server Agent service last started and discount any run that came due before that moment
- Compare the runs each schedule implies for the last seven days with the run count in sysjobhistory
- Check every enabled job for a disabled schedule attached to it
- Find every job whose next_run_date is already in the past and ask whether Agent was down when it came due
- Check the Agent history row limit before you trust a Ran figure that looks too low
Try Database Health Monitor Today
Missed Runs counts what every schedule says should have run against what the job history holds, so a job that never started finally shows up. Database Health Monitor shows it on every instance you connect, in the time it takes to open the report.
Download Database Health Monitor and run the Missed Runs report against your own server. There is nothing to configure first, and you will know inside a few minutes whether it tells you something you did not already know.