SQL CPU by Hour of Day
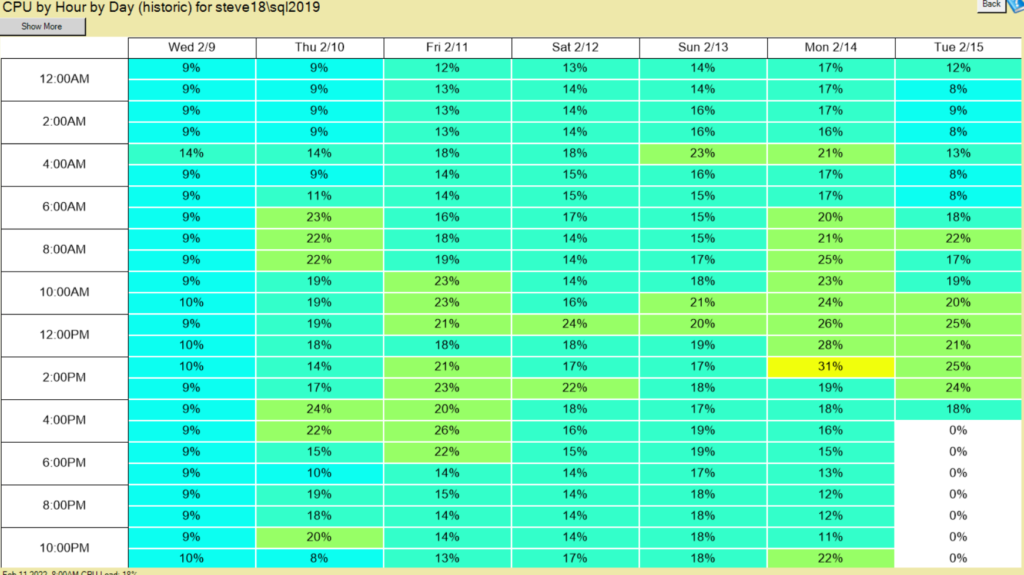
The SQL CPU by Hour of Day report lets you see what the average CPU load was per hour for the last week and beyond. I don’t know how many times I have used this report to explain to customers what is going on with their CPU load.

The SQL CPU Load by Hour of Day is an instance level report that has been part of Database Health Monitor for several years.
What is really nice with this report is you can see where your hot spots are for the last week on CPU load. It helps identify times that you have high CPU load and low CPU load, and from there you can look at things like jobs, ETL work, or other scheduled items that could be shifted around to better balance the load on the database. It may also show you if your SQL Server is bound by CPU at some part of the week. This could be an indicator that you need more CPU, either by adding more processors to a virtual machine, or by upgrading your physical hardware.
If this report shows minimal load, it could be a sign that you could take away CPU from the VM, or that this server may be a candidate for consolidation. For instance if you have 5 SQL Servers that are all underutilized you may be wasting valuable SQL Server licenses. Consolidating those multiple servers onto a single sever may reduce your licensing costs.
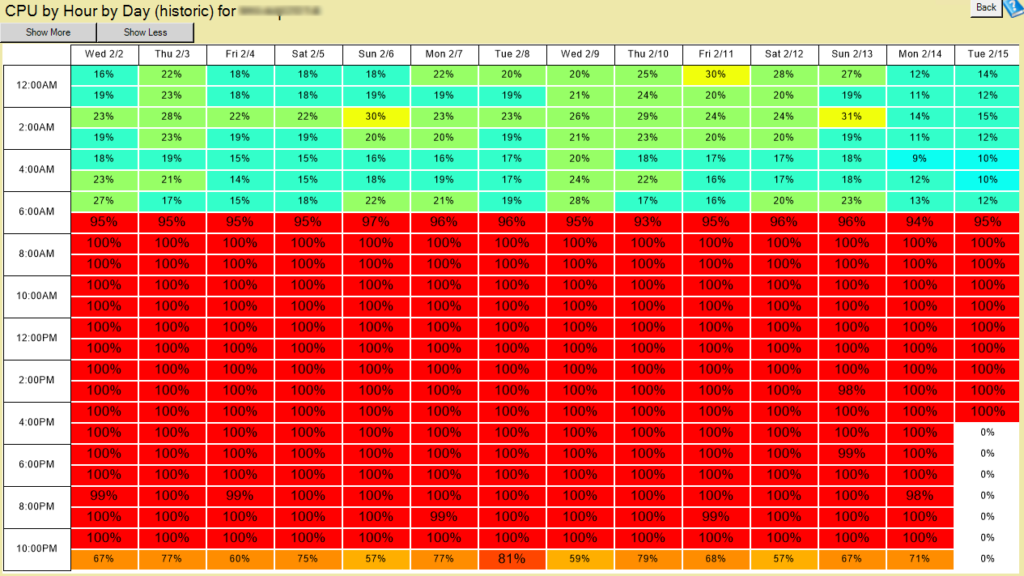
Here is an example of a sql server that is misconfigured and does not have enough CPU for the load.

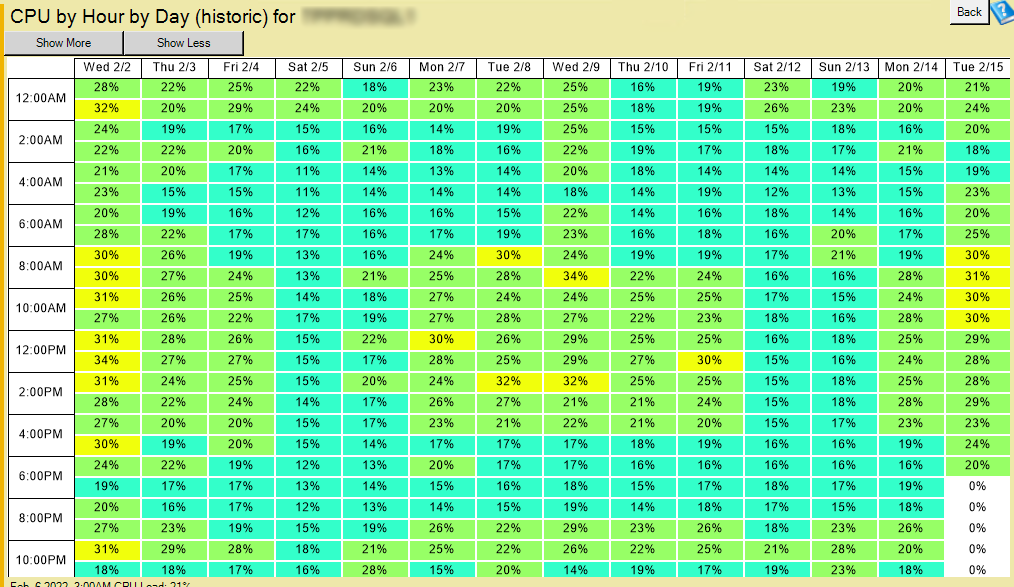
And here is an example of one that has a much better load.

By default the report shows you the last 7 days as columns and each hour of the day as a row with the average CPU load for that hour shown in the block. The show more or show less buttons on the top will allow you to go back and look at 2, 3 or ever 4 weeks of CPU history looking for trends.
To use the CPU by Hour of Day report, you need to have Historic Monitoring enabled for your SQL Server instance.

Leave a Reply