Database Overview

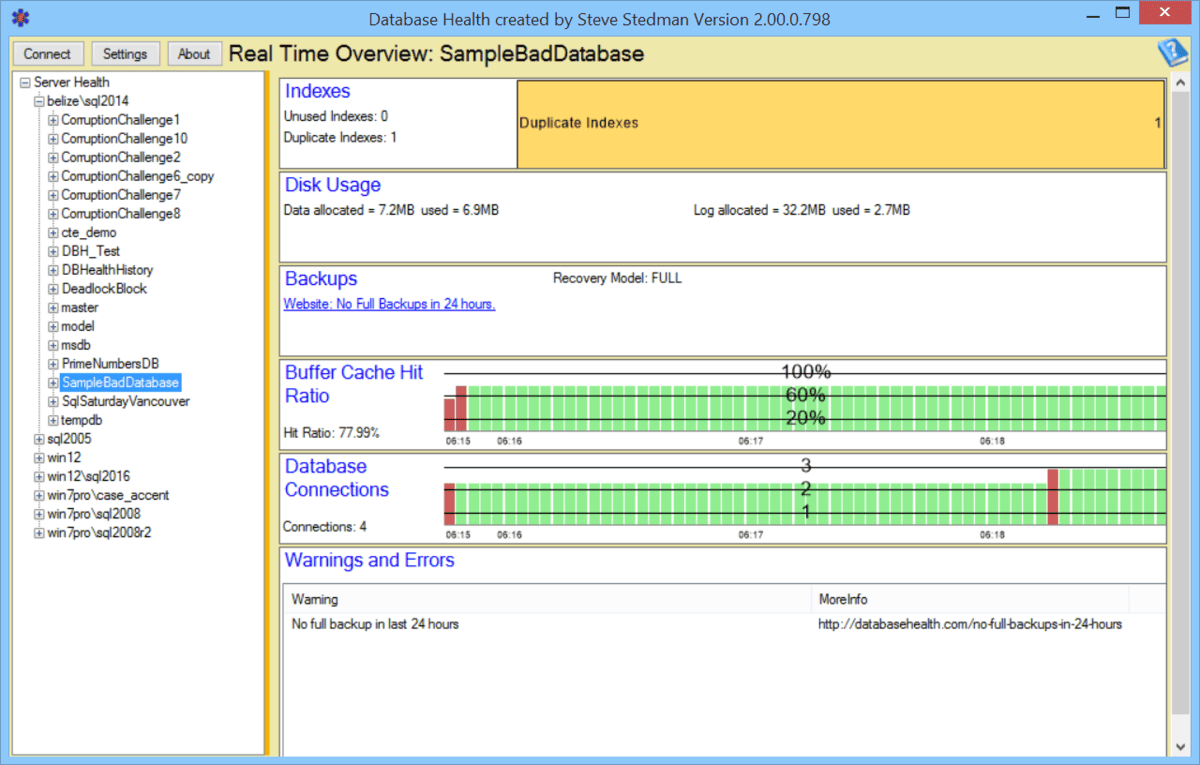
The Database Overview shows summary information for the following with links to the exact details for every item.  The purpose of this page is to give you a dashboard view of many areas that could be causing performance issues.

You get to the database overview report by expanding the SQL Server in the tree view on the left side of the screen, then just clicking on a database name.

Clicking on the different sections of the Database Real Time Overview allow you to drill down on the details behind that section of the report.

DatabaseOverviewReport

The database overview report is part of the Database Health Monitor application created by Steve Stedman of Stedman Solutions, LLC. Database Health Monitor is a free application that can be downloaded from DatabaseHealth.com.


Enroll Today!
SteveStedman5
SteveStedman5
Steve and the team at Stedman Solutions are here for all your SQL Server needs.
Contact us today for your free 30 minute consultation..
We are ready to help!

Contact Info

Stedman Solutions, LLC.
PO Box 3175
Ferndale WA 98248

Phone: (360)610-7833

5 Comments on “Database Overview

  1. Recommend parameter (and default to) sorting database names alphabetically. Also have a folder for system databases to seperate them from main list.

    Speaking of configurations, where/how/can you configure anything in the app?

  2. Need configuration option for refresh interval. It would be nice to also be able to control scale of moving charts.

  3. Why does the Buffer Cache Hit Ratio show ~25% when I see 99% from….
    SELECT (a.cntr_value * 1.0 / b.cntr_value) * 100.0 as BufferCacheHitRatio
    FROM sys.dm_os_performance_counters a
    JOIN (SELECT cntr_value,OBJECT_NAME
    FROM sys.dm_os_performance_counters
    WHERE counter_name = ‘Buffer cache hit ratio base’
    AND OBJECT_NAME = ‘SQLServer:Buffer Manager’) b ON a.OBJECT_NAME = b.OBJECT_NAME
    WHERE a.counter_name = ‘Buffer cache hit ratio’
    AND a.OBJECT_NAME = ‘SQLServer:Buffer Manager’;

    • Miles,
      This sounds like it would be better as an email with details and a screen shot showing where you are seeing the 25% in Database Health Monitor. If you could email me those to Steve at StedmanSolutions.com, I would be happy to investigate the issue.

      thanks,

      -Steve Stedman

Leave a Reply

Your email address will not be published. Required fields are marked *

*

To prove you are not a robot: *