Why Autogrowth in Percent Slows SQL Server Down
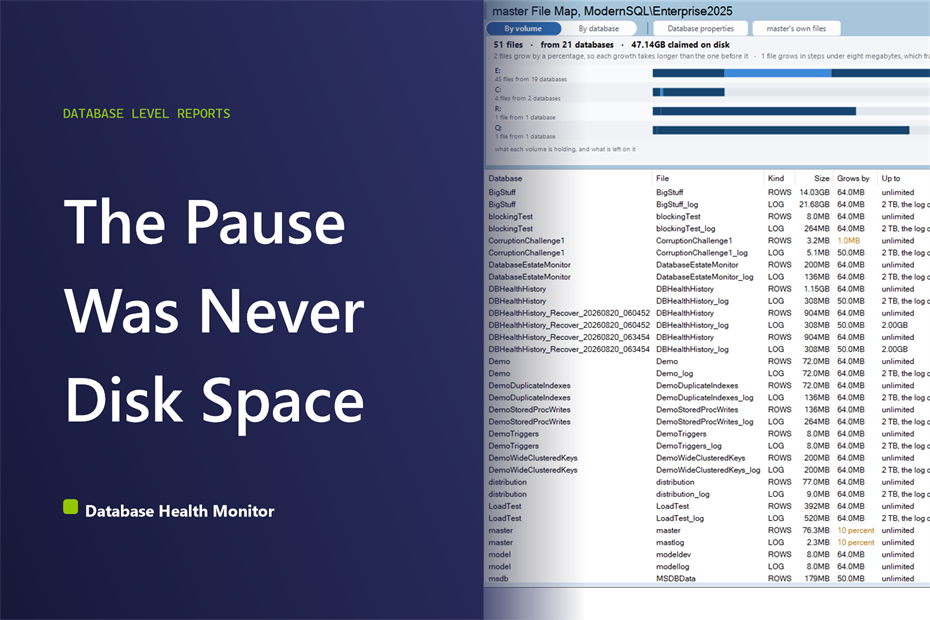
A nightly load job used to finish by eleven. Six months on it is still running past midnight, and nobody added rows that shouldn't be there. The database got slower on its own: every autogrowth event takes longer than the last, because the file grows using autogrowth in percent, not a fixed size, and ten percent of forty gigabytes already on disk is a long pause to sit through at 11:58 PM.
Why does autogrowth in percent make SQL Server slower over time? Autogrowth in percent makes each growth event larger than the last, because the increment is a percentage of a file that is already bigger than it was the previous time it grew. A ten percent setting on a forty gigabyte file adds four gigabytes at once, and every future growth adds more, so pauses get longer instead of staying constant.
The first instinct is to check the drive: how much room is left, how fast it's filling. That number is real, and it answers a different question. A volume with plenty of free space can still host a file that pauses on every single growth, because the problem was never how full the disk is, it's how the file was told to grow. Database Health Monitor's master File Map report is where that setting actually lives, for every database on an instance, at once.
master File Map: Every File, Even the Ones You Can't Open
Most of the file detail elsewhere in the product comes from 'sys.database_files', and that view only exists while SQL Server can actually open the database. A database that's offline, mid-restore, stuck in recovery, or flagged suspect disappears from those views entirely, files and all. 'sys.master_files' doesn't have that limitation: SQL Server keeps those file rows in master itself, independent of whether the user database can currently be opened, so a database SQL Server currently refuses to open still shows up with its full file list, sizes and growth settings intact. That's why this report exists as its own page instead of folding into the ones that already cover file size, and why a database showing up here with a State of suspect or recovery pending isn't a bug, it's the report doing exactly what it's built for.
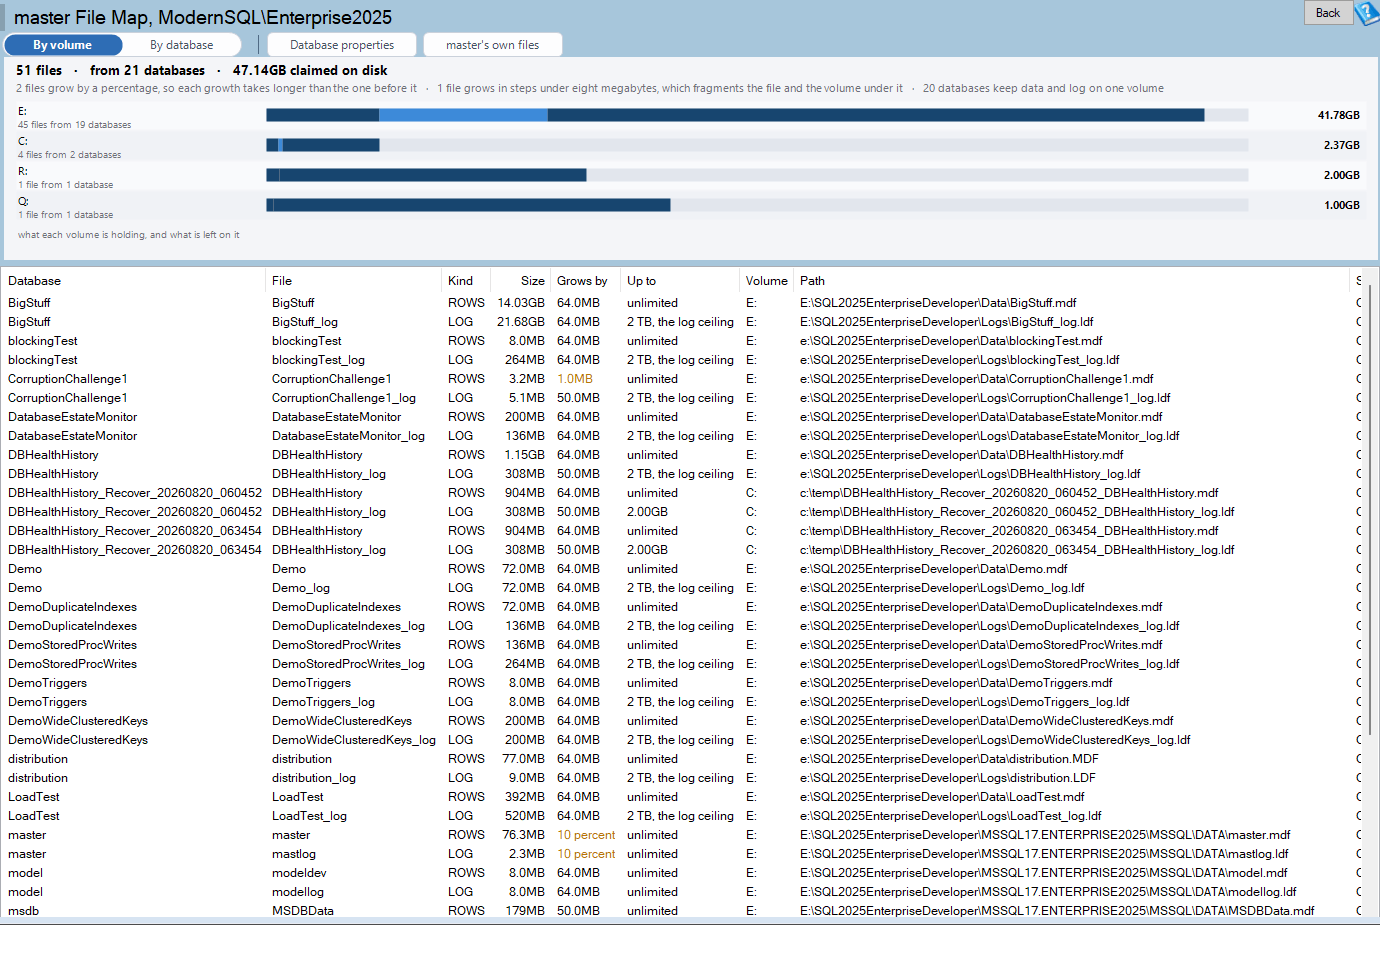
master File Map is one of the reports in Database Health Monitor. It runs against your own servers, and it takes about a minute to have this same screen open on one of them.
Autogrowth in Percent: Why It Compounds
A percentage growth setting doesn't stay the same size twice. Ten percent of a forty gigabyte file is four gigabytes; ten percent of forty four gigabytes is larger still. Every event is bigger than the one before it, so every event also takes longer, and a job running during one of those pauses just waits for it to finish. That's the real version of the story from the opening: a job doesn't get ten minutes slower for no reason, one file's growth got ten percent bigger every single time it fired. The opposite mistake looks nothing like it but costs just as much: a growth increment left at the default one megabyte can fire off hundreds of times in a single afternoon on a busy file, each one a small stall that adds up to the same lost time. Neither extreme is what a busy database file wants. The usual fix is a fixed increment sized for how the file actually grows, not a percentage and not the default.
Three of the values stored in 'max_size' aren't sizes at all, they're codes, and the grid spells them out in words instead of leaving them as raw integers.
| max_size value | What it actually means |
|---|---|
| -1 | No ceiling at all |
| 0 | This file cannot grow, ever, no matter what tries to fill it |
| 268435456 | SQL Server's built in two terabyte cap for log files, present whether anyone asked for it or not |
Every File's Growth and Ceiling, in One Grid

The grid is where all of this becomes a list you can sort. 'Kind' separates a file that holds rows from one that holds the log, filestream data or full text catalog, because they don't all deserve the same growth policy. 'Size' is already converted out of pages into something readable, since 'sys.master_files' stores it in eight kilobyte units and a raw 'size' of 1280 means nothing to a human until it's multiplied out to 10 MB. 'State' is the column that matters most for a database in trouble: online, offline, restoring, recovery pending, suspect or emergency, sitting right next to the files it belongs to, however that database got there.
The Volume Nobody Checked
Switch to the By volume view and the same files line up by drive instead of by database. That's the view that answers a different question: what's actually sitting on E:, and which databases would be affected if that array had a bad day. It's also the view that surfaces a mistake that's easy to make and easy to miss: a database with its log file on the exact same volume as its data. One drive failure then takes both the data and the only local copy of the transaction log, which is the one combination a restore strategy can't easily route around. Switching to By database instead answers the opposite question, gathering every file for one database wherever it happens to live.
The toolbar has one more shortcut worth knowing about: narrowing the whole grid down to master's own files, which get a more detailed report of their own elsewhere in the product.

A growth setting nobody has revisited since the day the database was created is exactly the kind of thing that sits quietly for years, then shows up as a Monday morning problem with no obvious cause. If that sounds familiar, SQL Server Technical Debt: Where to Start Fixing It covers the wider version of the same idea: a setting that was reasonable once and was never looked at again. The full column by column reference for this report, including every state value it can show, lives in the master File Map documentation.
What to check on your own server
- Query 'sys.master_files' on each production instance and check the growth column for every data and log file
- Flag any file whose growth is set as a percentage rather than a fixed size
- Compare each log file's volume to its data file's volume and note any database keeping both on one drive
- Check 'max_size' against the free space on that volume for any file carrying an explicit ceiling
- Replace a growth increment left at the one megabyte default with a fixed size sized for the file
Try Database Health Monitor Today
It puts every database's growth setting, ceiling and volume on one screen, including the files behind a database that won't open. Database Health Monitor shows it on every instance you connect, in the time it takes to open the report.
Download Database Health Monitor and run the master File Map report against your own server. There is nothing to configure first, and you will know inside a few minutes whether it tells you something you did not already know.
Related reading: SQL Server Job Slow When Others Run? Here's Why. A companion piece breaks down why an Agent job can take ten times longer whenever several others start at once, by comparing the busiest overlap each subsystem sees against the worker thread ceiling SQL Server Agent enforces for it.
Related reading: master Backup Out of Date? Here's How to Check It. A companion piece looks at why a master backup that ran successfully every night can still be missing logins, role grants, and linked servers created since, and how to see that gap in one glance instead of subtracting dates by hand.