Find SQL Server Unused Indexes Before They Cost You
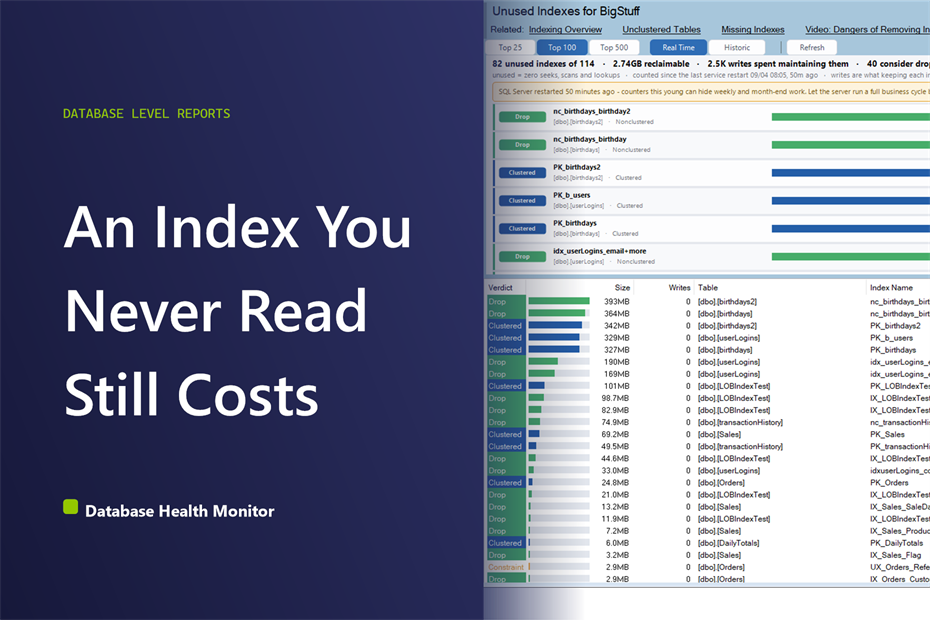
Every week the nightly load job runs a few minutes longer, and every week somebody nudges the maintenance window to cover it. Go looking for where the time and the disk space are going, and the biggest objects in the database are usually SQL Server unused indexes nobody remembers asking for – built for a query that stopped running years ago, or left behind by a migration two versions back.
How do I find SQL Server unused indexes? SQL Server unused indexes turn up by querying sys.dm_db_index_usage_stats for indexes with zero seeks, scans, and lookups since the last restart, then ranking what remains by reclaimable space and the writes spent maintaining it. Not every hit is safe to drop: constraints, clustered indexes, and disabled indexes need a different response entirely.
The number everyone checks first
The first instinct is to sort by size and start dropping whatever is biggest, or to chase a fragmentation percentage and rebuild whatever crosses a threshold. Both feel like progress, and neither answers the only question that matters here: is anything actually reading this index. A rebuild spends log and CPU maintaining an index nobody queries. Sorting by size alone just finds the biggest objects in the database, and that is often a clustered index – which is the table itself, not a candidate for anything.
What sys.dm_db_index_usage_stats actually counts
SQL Server already keeps the number that matters. sys.dm_db_index_usage_stats tracks every seek, scan, lookup and write against every index since the service last started. Zero seeks, zero scans and zero lookups next to write activity that keeps ticking over is the honest definition of an unused index – something paid for on every insert and update and never once read back. The catch is that the counters reset with the service. An index that looks untouched may simply be young rather than dead, and an instance restarted an hour ago will make everything on the page look unused.
Reading the SQL Server Unused Indexes report
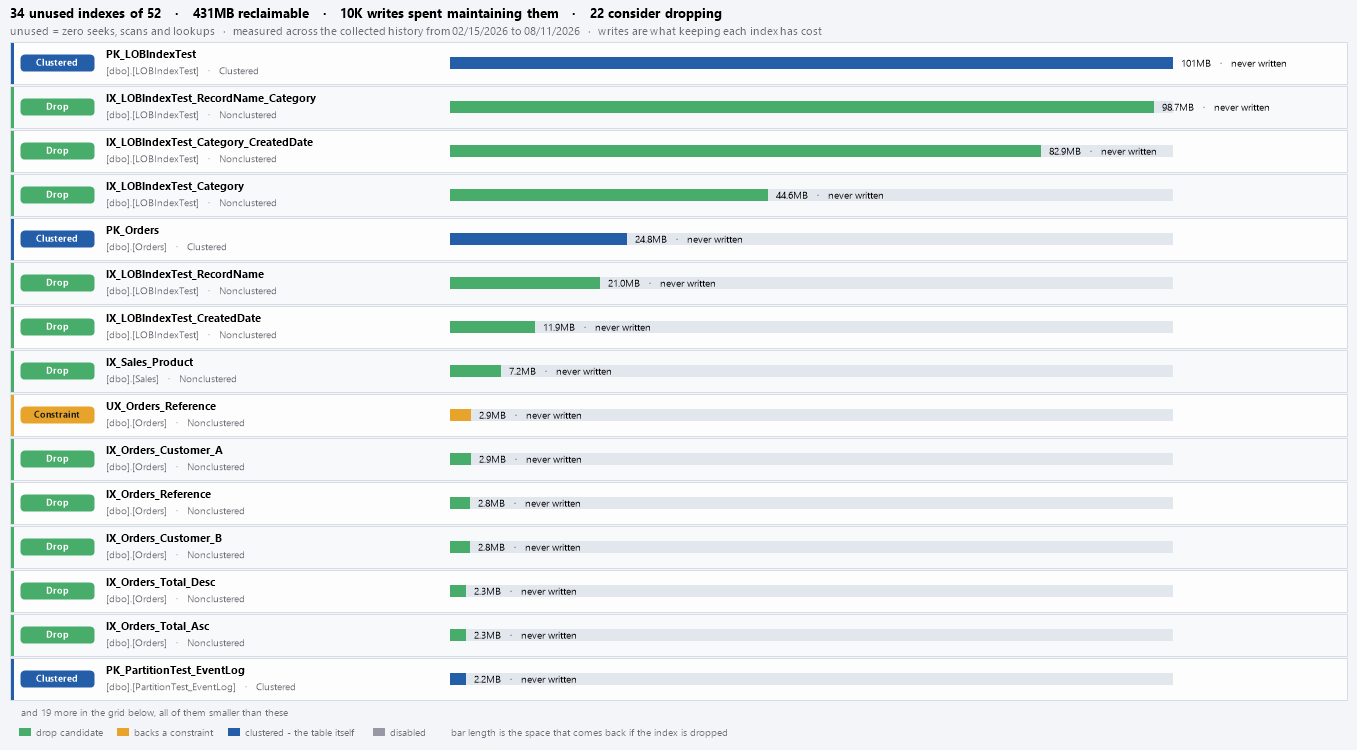
This is exactly what the Unused Indexes report in Database Health Monitor builds for a database you pick from the tree. It ranks every index with zero seeks, scans and lookups by how much space dropping it would return, and sets that next to how many writes the index has cost since the counters started. The restart warning sits right on the page as an amber band instead of waiting in an advisor dialog for you to remember it.
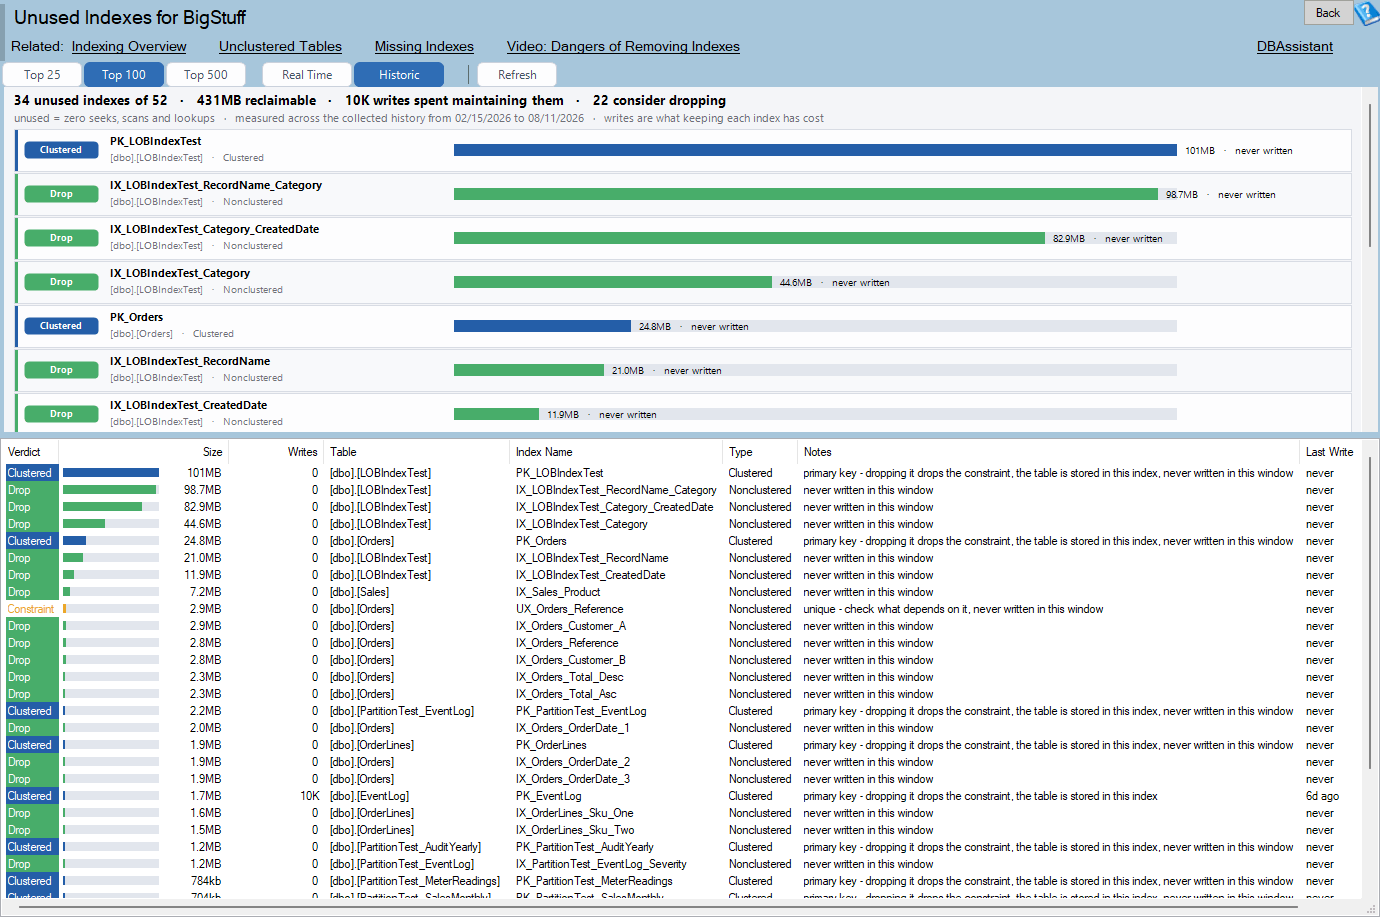
Unused Indexes is one of the reports in Database Health Monitor. It runs against your own servers, and it takes about a minute to have this same screen open on one of them.
Verdicts before you drop anything
Not every zero-read index is a drop. Every row on the grid carries a verdict, because unused and removable turn out to be two different questions.
| Verdict | What it means |
|---|---|
Drop | No usage at all – the row you actually came for |
Constraint | Backs a primary key or unique constraint, so dropping it drops the constraint |
Clustered | It is the table itself; removing it turns the table into a heap |
Disabled | Already doing nothing – a different fix than a drop |
Size next to Writes is the pair worth reading together, not Size on its own. A large index with heavy write traffic and a Drop verdict is the cleanest win on the page – space back, and a write removed from every insert and update on that table from here on. A small index that is barely written moves the needle in neither direction.

Patterns worth knowing before you script anything
- A large index carrying heavy writes and a
Dropverdict is the cleanest win the report produces – every insert and update has been paying for it with nothing read back - Several unused indexes stacked on the same table usually means someone acted on missing-index suggestions without checking what already existed; Duplicate Indexes is worth a look too
- Every index showing unused right after a restart means the counters are empty, not the indexes – the amber band is telling you to wait, not to drop
- An index with a
Constraintverdict is a decision about what the table guarantees, not really an indexing decision at all
Nothing to clean up, or too much to check
Run this against a database that has genuinely been kept clean and instead of an empty grid, the report says plainly that every index has already been used and there is nothing to clean up.
On a database with a great many indexes, the read itself can take a while – the query behind this report walks every index and everything ever written against it. Past roughly four hundred milliseconds a loading panel takes over the window and counts indexes off as they arrive, instead of leaving the application looking like it has stopped responding. If a very large database still will not finish inside that window, the fix is not to wait longer – it is to drop down to Top 25 from the toolbar, or to work through a Top 500 as several smaller passes instead of one that never returns. Missing Indexes is worth pairing with this report too: dropping one index here may be exactly what pays for adding a different one there. And an index that shows up as Disabled belongs to Problem Indexes, not a drop script.
What to check on your own server
- Check the restart band before you trust any row as unused
- Filter your attention to Drop verdicts first
- Read Size and Writes together, not size alone
- Check Last Write on anything you are about to drop
- Script the drop, read it, and run it in a controlled window
Try Database Health Monitor Today
It finds the indexes that cost you a write on every insert and update while returning nothing, and tells you which ones are actually safe to drop. Database Health Monitor shows it on every instance you connect, in the time it takes to open the report.
Download Database Health Monitor and run the Unused Indexes report against your own server. There is nothing to configure first, and you will know inside a few minutes whether it tells you something you did not already know.
Related reading: Why a Wide Clustered Index Costs More Than You Think. A related report ranks tables by how much a wide clustering key actually costs once you multiply in row count and every nonclustered index carrying it, rather than by key width alone.
Related reading: SQL Server Technical Debt: Where to Start Fixing It. A related post walks through how weighting 'NOLOCK' hints, cursors, and other T-SQL habits by what they actually cost turns a vague sense of bad code into a single score and a dollar figure worth handing to a manager.