SQL Server Performance Monitor Tool
Database Health Monitor, the SQL Server Performance Monitor Tool.
Efficiently managing SQL Server performance can be challenging without the right tools. Identifying bottlenecks, monitoring resource usage, and resolving database issues require continuous effort and expertise. Enter Database Health Monitor, the ultimate SQL Server performance monitor tool designed to simplify monitoring and optimization tasks for DBAs and developers.
In this article, we’ll explore how Database Health Monitor works, its key features, and why it stands out as the go-to SQL Server performance monitor tool for enhancing database performance and reliability.
Why Use a SQL Server Performance Monitor Tool?
SQL Server environments are complex and require regular monitoring to maintain performance. A specialized SQL Server performance monitor tool like Database Health Monitor offers critical benefits:
- Proactive Problem Detection: Identify issues before they escalate into major performance bottlenecks.
- Resource Monitoring: Track CPU, memory, and disk usage to prevent over-utilization.
- Query Analysis: Spot slow-running queries and execution plan inefficiencies.
- Health Insights: Detect database corruption, index fragmentation, and other hidden issues.
Database Health Monitor consolidates these capabilities into one easy-to-use platform, making it the preferred SQL Server performance monitor tool for professionals.
Key Features of Database Health Monitor
1. Real-Time Performance Monitoring
Real-time insights into SQL Server health and performance are critical for staying ahead of potential issues.
How It Helps:
- Tracks CPU, memory, and disk usage metrics in real time.
- Monitors TempDB usage and identifies contention issues.
- Sends alerts for high-priority problems like blocking, deadlocks, or high wait times.
Use Case:
Imagine you’re managing a busy production server, and suddenly CPU usage spikes. With Database Health Monitor, you can instantly identify the query or process causing the spike, allowing you to take immediate corrective action.
2. Query Performance Analysis
Slow queries are among the most common causes of poor database performance. Database Health Monitor simplifies query analysis.
How It Helps:
- Displays the top resource-consuming queries.
- Highlights inefficient execution plans, such as table scans or missing indexes.
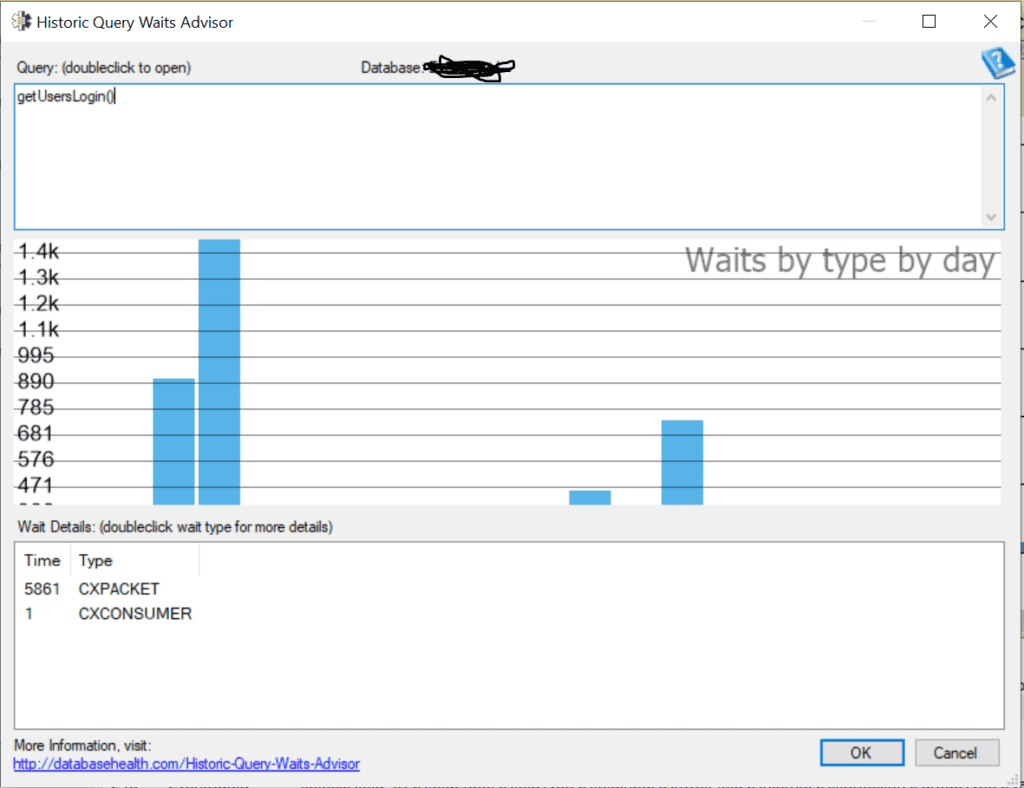
- Monitors query wait statistics to identify common bottlenecks.
Use Case:
A developer reports that a critical application is running slower than usual. Using Database Health Monitor, you discover that a query is performing a table scan due to a missing index. After adding the recommended index, the application’s response time improves significantly.
3. Index Optimization
Indexes are essential for query performance, but they need regular management to remain effective.
How It Helps:
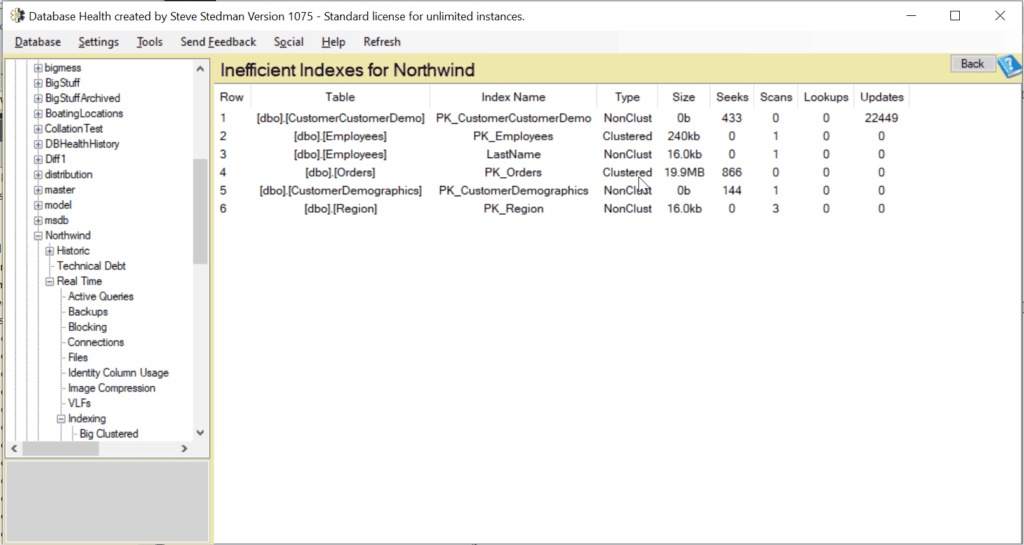
- Identifies missing, unused, or duplicate indexes.
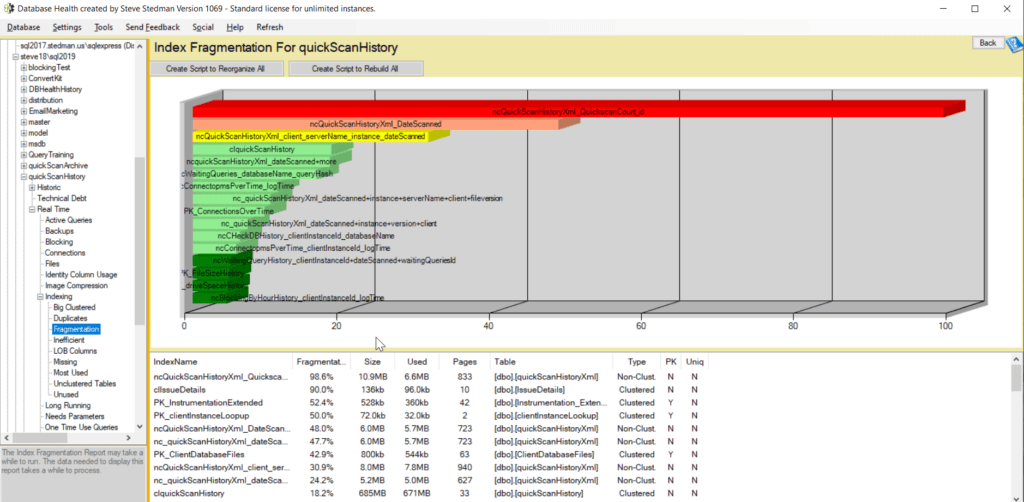
- Tracks index fragmentation and suggests whether to rebuild or reorganize.
- Provides detailed recommendations for creating or modifying indexes.
Use Case:
A DBA uses Database Health Monitor to review index fragmentation reports. After rebuilding heavily fragmented indexes, query performance improves during peak usage hours.


4. Wait Statistics Analysis
Wait statistics reveal delays caused by resource contention or inefficiencies.
How It Helps:
- Categorizes waits (e.g.,
CXPACKET,PAGEIOLATCH,ASYNC_NETWORK_IO) and ranks their impact on performance. - Provides actionable insights into resolving common waits.
- Tracks trends over time to identify recurring issues.
Use Case:
During routine monitoring, you notice high CXPACKET waits in a workload. Adjusting the server’s MAXDOP setting reduces parallelism issues, improving performance.

5. Comprehensive Health Reports
Regular reports are crucial for understanding SQL Server health and planning improvements.
How It Helps:
- Generates detailed reports on server performance, resource usage, and query efficiency.
- Offers a visual dashboard to summarize performance metrics at a glance.
- Allows customization of reports to focus on specific areas of concern.
Use Case:
A monthly health check report from Database Health Monitor reveals an increase in TempDB contention. The DBA adjusts TempDB file configurations, reducing contention in subsequent months.
6. Deadlock and Blocking Monitoring
Deadlocks and blocking can bring your SQL Server to a standstill if not addressed quickly.
How It Helps:
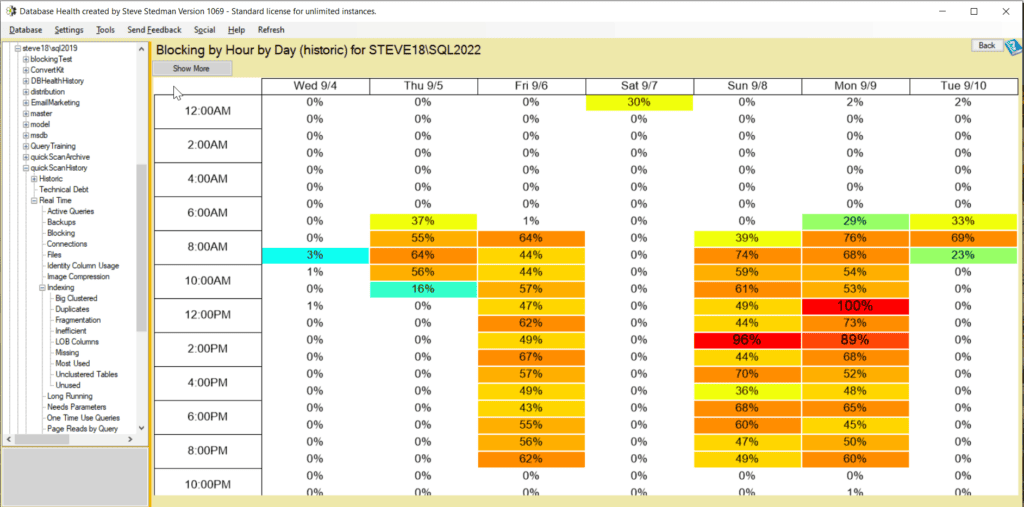
- Detects and visualizes blocking chains to identify problematic queries.
- Tracks deadlock occurrences and provides detailed diagnostics.
- Helps tune queries or adjust isolation levels to minimize conflicts.
Use Case:
During a busy sales event, Database Health Monitor alerts you to a deadlock. With its detailed report, you optimize the conflicting queries, ensuring smooth transactions for end-users.

7. Resource Utilization Insights
Effective SQL Server performance relies on balanced resource usage.
How It Helps:
- Tracks long-term trends in CPU, memory, and disk usage.
- Identifies resource-intensive queries and workloads.
- Helps forecast future hardware needs based on usage patterns.
Use Case:
A review of historical trends in Database Health Monitor shows consistent high memory usage. You allocate additional memory to SQL Server, eliminating query slowdowns during peak hours.
Why Choose Database Health Monitor?
Database Health Monitor isn’t just another SQL Server performance monitor tool. It’s a comprehensive solution designed to empower DBAs and developers with actionable insights, proactive alerts, and performance-tuning recommendations.
Top Benefits:
- Ease of Use: Intuitive interface with minimal setup required.
- Comprehensive Features: Covers every aspect of SQL Server monitoring and tuning.
- Cost-Effective: Free to use, offering enterprise-grade functionality without the price tag.
- Continuous Updates: Regular enhancements ensure the tool stays ahead of emerging challenges.
How to Get Started with Database Health Monitor
- Download the Tool: Visit DatabaseHealth.com to download the latest version.
- Install and Configure: Install the tool and connect it to your SQL Server instance. Configuration is quick and straightforward.
- Explore Reports: Start with built-in reports to understand your server’s health and performance.
- Address Issues: Use the insights provided to resolve bottlenecks, optimize queries, and maintain database reliability.
Conclusion
For anyone responsible for SQL Server performance, having the right monitoring solution is essential. Database Health Monitor stands out as a powerful, user-friendly, and reliable SQL Server performance monitor tool. It equips you with the insights and tools needed to keep your databases running at peak efficiency.
Start optimizing your SQL Server today—download Database Health Monitor and experience the benefits of real-time monitoring, comprehensive reports, and actionable insights. For expert assistance, consider partnering with Stedman Solutions’ Managed Services for ongoing support.