How to Monitor Database Performance

How to Monitor Database Performance with Database Health Monitor
Ensuring that your SQL Server databases are running smoothly is critical for any organization. Consistent monitoring helps prevent performance issues before they escalate into bigger problems. One of the best tools available for this purpose is Database Health Monitor. It’s a free and comprehensive tool designed for real-time monitoring, performance analysis, and proactive diagnostics of SQL Server environments.
In this post, we’ll guide you through the process of using Database Health Monitor to effectively monitor database performance.
Why Monitor SQL Server Performance?
SQL Server performance monitoring isn’t just about detecting issues—it’s about maintaining efficiency and ensuring consistent database availability. Without proper monitoring, databases can suffer from slow queries, high resource usage, or even crashes. Regular monitoring helps you:
- Identify slow queries and optimize them.
- Monitor resource consumption such as CPU, memory, and disk I/O.
- Spot blocking and deadlock problems.
- Track index usage and fragmentation.
- Stay on top of disk space availability.
Getting Started with Database Health Monitor
Database Health Monitor is specifically built to help DBAs manage SQL Server performance. Here’s how you can get started and what to expect from this powerful tool.
Step 1: Download and Install
Begin by downloading Database Health Monitor from DatabaseHealth.com. It’s a lightweight installation and can run on any workstation connected to the SQL Server you want to monitor. Once installed, open the application and connect it to your SQL Server instances using either SQL Server Authentication or Windows Authentication.
Step 2: Explore the Performance Dashboard
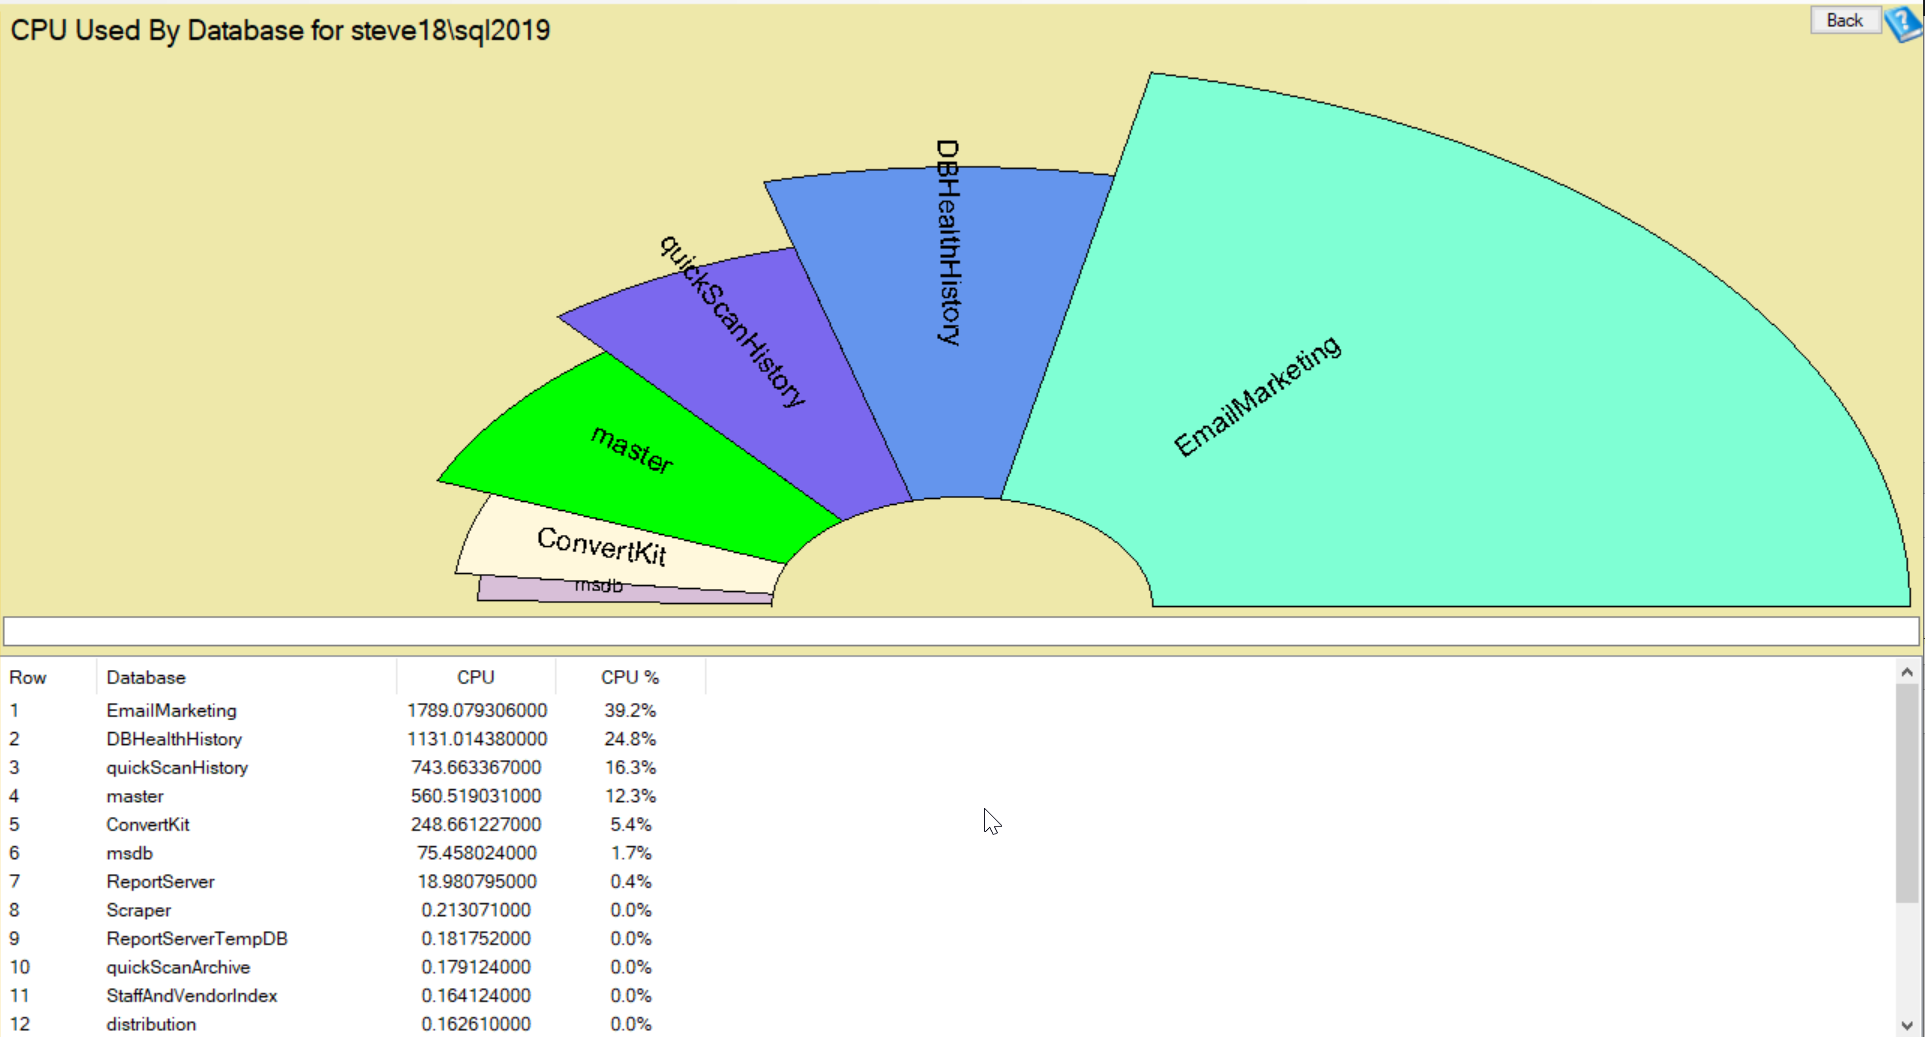
The Performance Dashboard in Database Health Monitor provides an overview of real-time metrics, including:
- CPU Usage: See how much CPU your SQL Server is consuming and whether it’s hitting critical thresholds.
- Memory Utilization: Track memory usage to ensure your server has adequate resources.
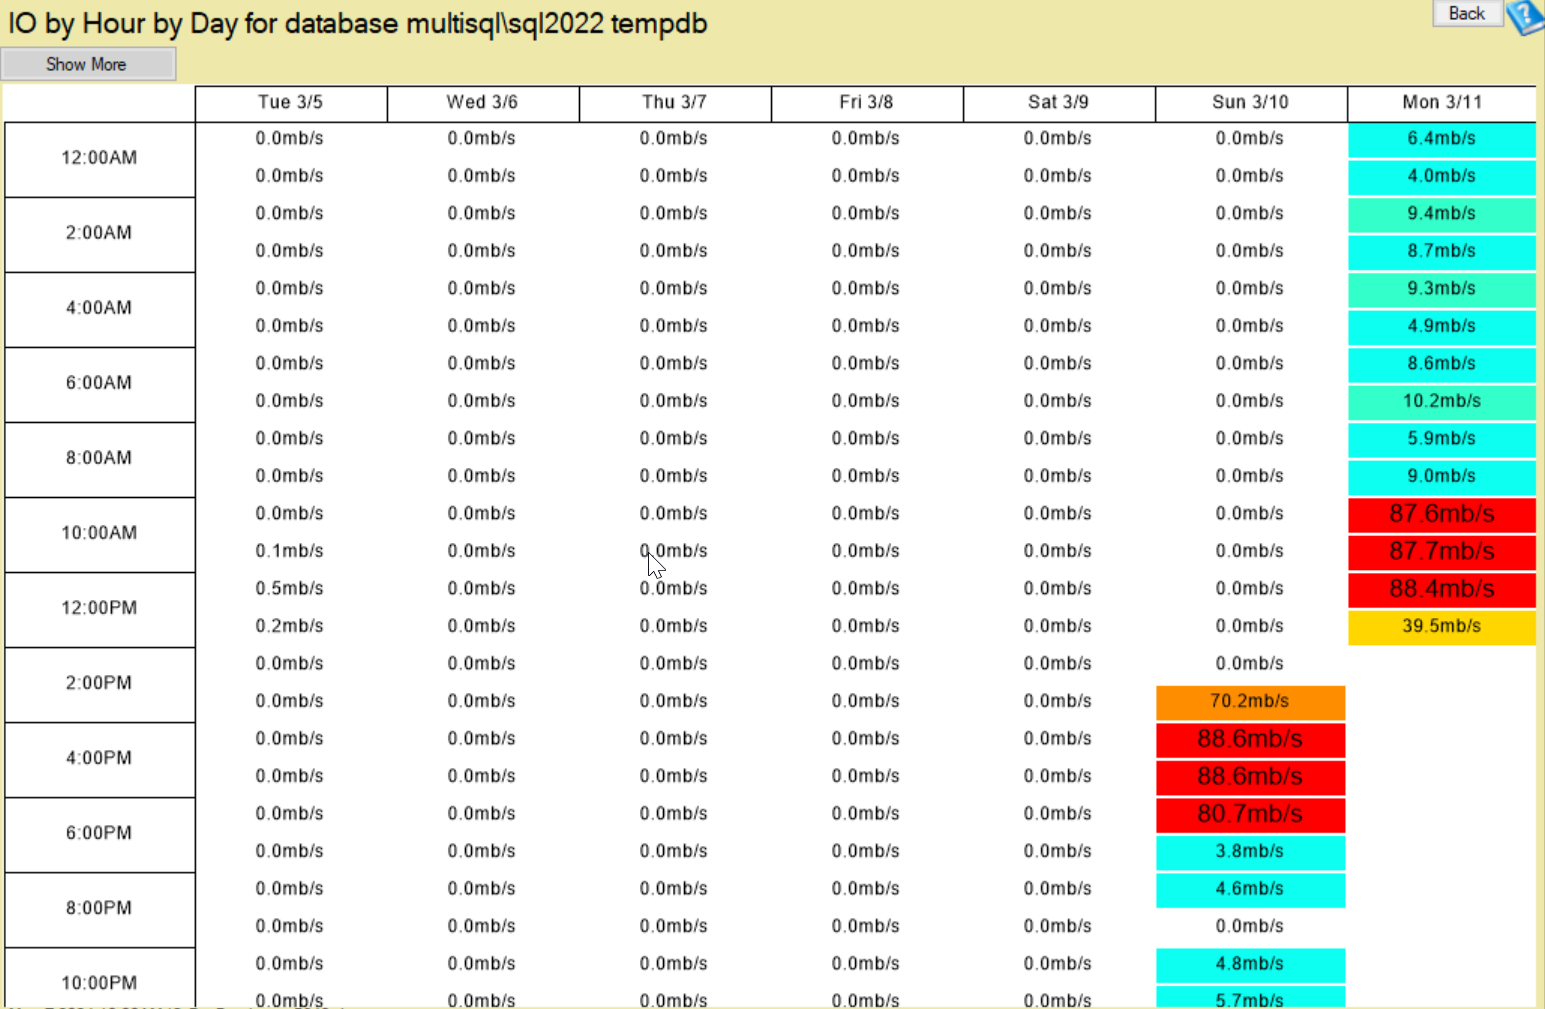
- I/O Utilization: Monitor read and write speeds to identify potential bottlenecks in disk performance.
This dashboard serves as your starting point for performance monitoring, offering instant visibility into your SQL Server’s health.
Step 3: Use the Wait Stats Analysis
Wait stats are a vital part of SQL Server Performance Tuning. Database Health Monitor provides a Wait Stats Analyzer that breaks down wait types, showing where SQL Server is spending most of its time waiting.
- Identify top wait types and their duration, allowing you to quickly pinpoint which resource is causing delays.
- Focus on specific waits like PAGEIOLATCH_SH (indicating disk I/O issues) or CXPACKET (related to parallelism), so you know exactly where to target your tuning efforts.
Step 4: Analyze Query Performance
To identify slow queries, use the Top 10 Queries report. This feature shows the queries consuming the most resources based on metrics like:
- CPU time.
- I/O operations.
- Duration.
Once identified, you can drill down into the execution plans to understand why these queries are performing poorly. This helps you optimize them, whether through index changes, query rewrites, or adjustments to server settings.
Step 5: Monitor Index Health
Database Health Monitor provides several tools for index analysis:
- Fragmentation Analysis: Identify which indexes are heavily fragmented and need to be reorganized or rebuilt.
- Missing Indexes Report: Spot missing indexes that could improve query performance.
- Unused Indexes: See which indexes aren’t being used, so you can remove or modify them to free up resources.
Step 6: Stay Alert for Blocking and Deadlocks
Blocking and deadlocks can cause severe slowdowns, especially in high-transaction environments. With Database Health Monitor, you can:
- Track blocking chains: See which sessions are causing blocking and identify the root blocker.
- Analyze deadlocks: Review deadlock graphs to understand which queries or transactions caused the deadlock and make adjustments to prevent them in the future.
Step 7: Keep an Eye on Disk Space and I/O
Disk space and I/O performance are often overlooked until they cause major issues. Database Health Monitor includes disk usage reports that track:
- File sizes for both data and log files.
- Disk I/O performance metrics to monitor read/write speeds and detect any slowdowns.
- Disk space alerts that notify you before space becomes critical.
Step 8: Monitor Database Integrity
Regular integrity checks are essential for maintaining a healthy SQL Server. Database Health Monitor automates DBCC CHECKDB checks, making it easier to identify Corruption early and respond quickly.
- Set up scheduled integrity checks for each database.
- Review any integrity errors that appear, and use the tool’s guidance to resolve them before they escalate into data loss.
Best Practices for Monitoring with Database Health Monitor
To make the most of Database Health Monitor, follow these best practices:
- Review performance trends regularly, not just when there’s an issue.
- Set up alerts to be notified about potential problems like blocking, high resource usage, or disk space issues.
- Analyze historical data to spot recurring issues, such as slow queries or index fragmentation.
- Incorporate index maintenance into your regular routines based on the tool’s reports.
- Stay proactive by regularly checking wait stats, slow queries, and disk usage, ensuring that your SQL Server remains optimized.
Conclusion
Using Database Health Monitor to monitor SQL Server Performance gives you a powerful edge in maintaining a stable, high-performing environment. By regularly checking dashboards, analyzing queries, monitoring indexes, and addressing resource issues, you can significantly improve your SQL Server’s efficiency and uptime.
If you want additional support in monitoring or managing your SQL Server environments, consider our SQL Server Managed Services at Stedman Solutions. We provide continuous monitoring, proactive tuning, and expert guidance to keep your databases running smoothly. To learn more or schedule a consultation, contact us here.


