Wait Monitoring
SQL Server wait statistics refer to the amount of time that a SQL Server process spends waiting on certain types of events or resources before it can complete its work. These events or resources could include things like locks on database objects, network communication, or access to disk storage. By monitoring wait statistics, you can get a better understanding of what might be causing performance issues for your SQL Server, and take steps to address the underlying problems. For example, if you see that a particular query is spending a lot of time waiting for locks, you could try optimizing the query or increasing the number of available locks to improve performance.
5 Dimensions of Wait Time Drill Down
Drill down on queries causing the most wait time by the following dimensions; time, host name, login, database, and instance. With these dimensions you can quickly find details on the query or queries causing the most waits on your SQL Server.
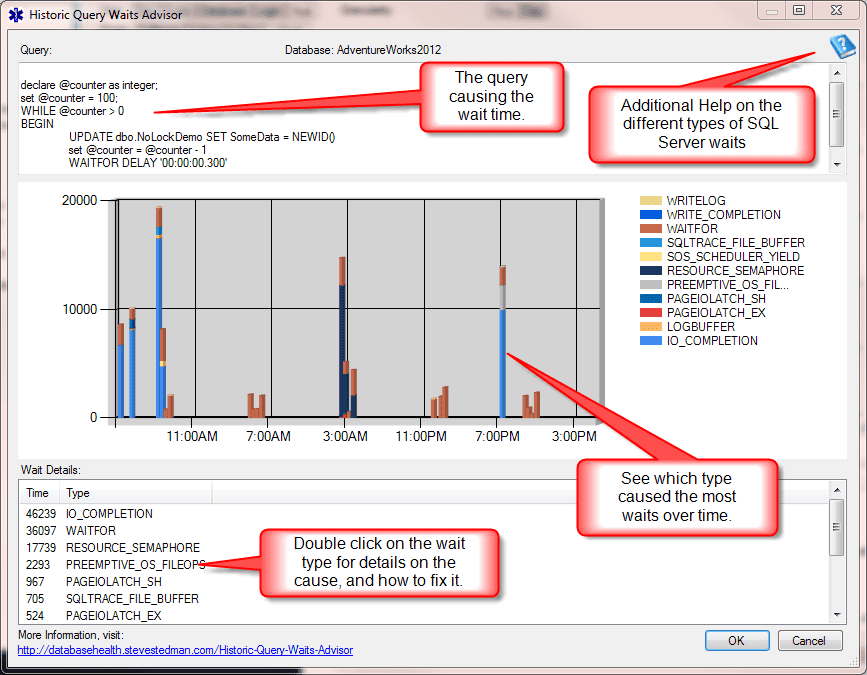
Waits Advisor
Once you find the problem query, use the Waits Advisor to analyze the query and figure out what needs to be done to fix it. You don’t know what the specific wait type means, just click on it and get details and suggestions on how to improve your query.

Related Links:
Leave a Reply