Finding Rarely Read Tables Before Your Disk Fills Up
The data drive is at 86 percent, and in the spring it was at 71. Nobody can say which of the big tables on it anyone still needs. You sort by size and the top five are no surprise, because the top five are always the same. What that list cannot tell you is which of them are rarely read tables, growing a little every night for an audience of zero.
How do I find rarely read tables in SQL Server? Compare each table's size with how often its indexes are read. Divide reads per day by gigabytes to get heat. A table that is large, almost never read, and only ever grows is a cold archive candidate. Daily size history plus index usage history, kept across restarts, gives you that comparison without guessing.
Database Health Monitor answers that with its Cold Data Finder report. It joins two histories it already keeps: the daily size of every table and the daily reads and writes of every index on it.
Why size alone sends you the wrong way
Sorting by size puts the busy orders table next to the audit table. Both are huge. One is hit all day. The other is only ever appended to. The ranking cannot tell them apart, and that difference is the whole decision.
The usual second move is to query sys.dm_db_index_usage_stats. It helps, with two catches. Its counters reset when the instance restarts, so a table that looks idle after a patch weekend may simply have lost its memory. And a raw read count means nothing without a size beside it. Three reads a day against 20 MB is noise. Three reads a day against 400 GB is a very expensive habit.
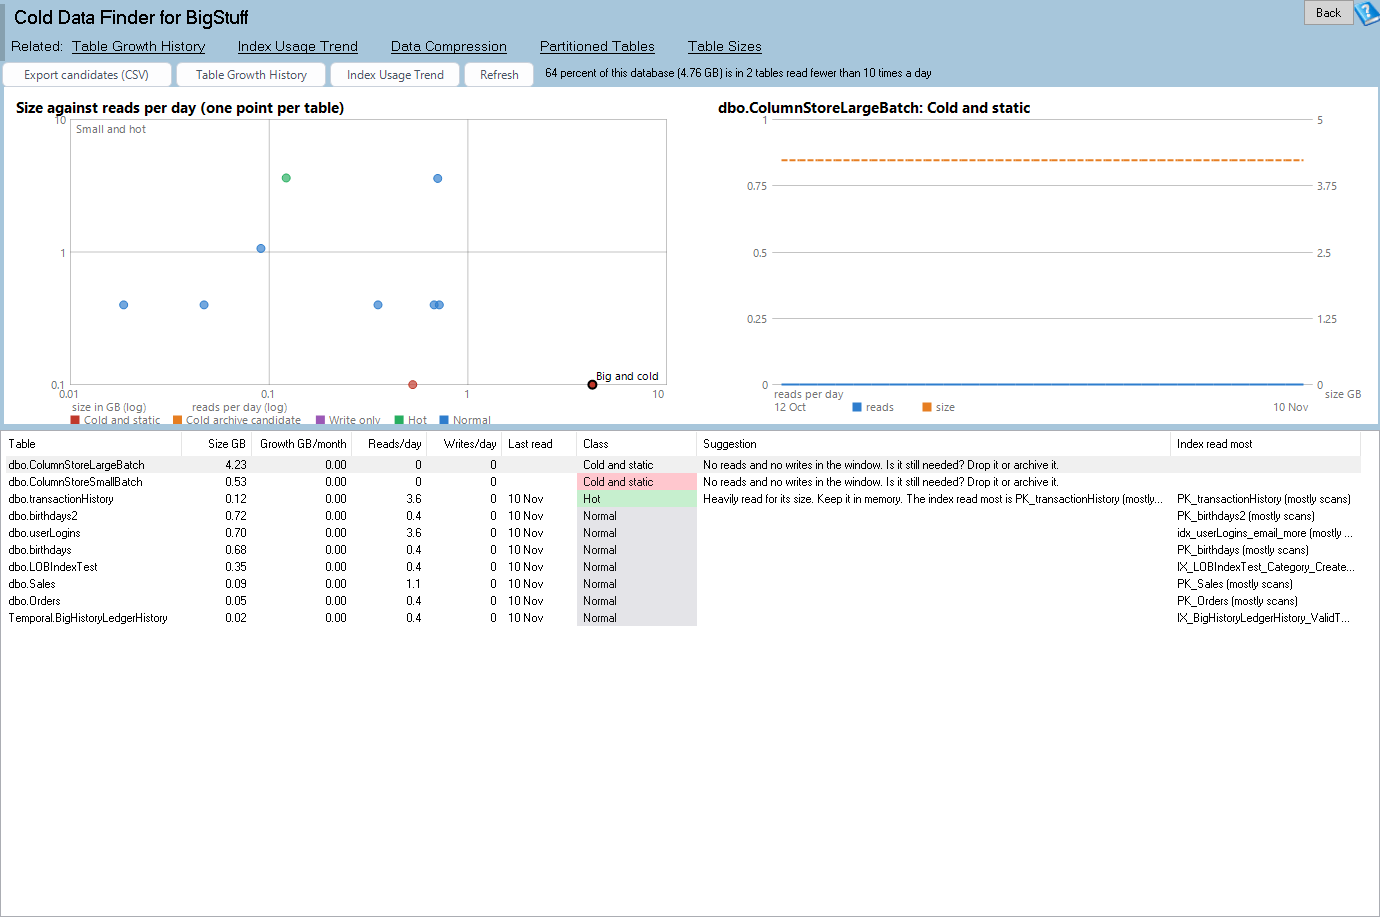
Cold Data Finder is one of the reports in Database Health Monitor. It runs against your own servers, and it takes about a minute to have this same screen open on one of them.
Heat: the number that finds rarely read tables
The honest measure is heat, reads per day per GB. Sizes come from dbo.TableGrowthHistory and usage from dbo.IndexUsageOverTime, both in DBHealthHistory. Reads are seeks plus scans plus lookups, writes are updates, and both are summed across every index on the table. A heap counts too.
The window is the last 30 days, or the retention you have if that is shorter. Averages use only the days the history really covers, so a server you started watching last week is not flattered by three weeks of blank days. Tables under the tracking minimum, 10 MB by default through TableGrowthMinimumMB, are left out on purpose. They are not your space problem.
Each table lands in one of six classes:
| Class | What puts a table there |
|---|---|
| Cold and static | No reads and no writes in the window |
| Write only | Being written to, but read less than once a day |
| Cold archive candidate | 1 GB or more, under 10 reads a day, and the row count never shrinks |
| Hot | The top tenth of what is left, ranked by heat |
| Normal | Everything else |
| Too new | Under 7 days of usage history, so no verdict yet |
The first three are the cold classes. The headline adds them up and tells you what share of the database's reserved space they hold.
What to do with the answer
Start with the chart. Every table is a dot, size runs across and reads per day runs up, both on log scales, with dot size showing monthly growth. Look at the bottom right corner: big and quiet. Click a dot and the second chart plots that table's daily reads over its size. The grid beside it carries growth per month, reads and writes per day, the last day anything read it, and the index doing most of the reading, scan or seek.
Read that index column before you act. A read here is an operation, not a row. One scan a day registers as a single read, yet it may be the nightly report somebody depends on. That is why the page says rarely read, never unused.
Once you trust a candidate, the usual moves are to partition it by date and compress the old partitions, or move it somewhere cheaper. The Export candidates (CSV) button saves the cold tables, largest first, ready to hand to whoever owns the data. This page does not show compression state, so check the Data Compression report first. The full column reference is in the Cold Data Finder documentation.
All of this rests on history collected over time. If you have not seen how that history is gathered, SQL Server Historic Reporting: One Page, One Click is the place to start.
What to check on your own server
- List your ten largest tables and note which ones you believe are read every day
- Count reads per day for each as seeks plus scans plus lookups across all its indexes, heap included
- Compare those reads with writes per day to spot tables that are only ever appended to
- Check which index takes the reads and whether it is scanned or sought before calling a table unused
- Review the compression state of each cold table before deciding to partition it by date
Try Database Health Monitor Today
Cold Data Finder shows which big tables nobody reads, so you can archive or compress them instead of buying more disk. Database Health Monitor shows it on every instance you connect, in the time it takes to open the report.
Download Database Health Monitor and run the Cold Data Finder report against your own server. There is nothing to configure first, and you will know inside a few minutes whether it tells you something you did not already know.