Database Health Monitor 4.1993: 19 New Reports on How Your Workload Really Behaves
Database Health Monitor version 4.1993 is the release about the workload, not just the counters. It adds 19 new reports on how queries, tables and transactions behave over time, a much deeper Query Tuning Workbench, all instances views of disk space, security and encryption, event markers on the time based charts, a set based synchronization mode for Data Compare, and more than 1,200 fixes.
This post walks through the release in the order you are most likely to use it. If you only want the headline, read the sections on the workload reports and the Query Tuning Workbench, then come back for the rest once the installer has finished.
The theme: the workload and the people and settings behind it
Counters tell you that something is busy. They do not tell you what is making it busy, whether that changed last Tuesday, or whether adding more concurrency would help at all. The reports in 4.1993 take that next step. They ask which tables the workload really spends its time in, when it changed character, how many requests run at once and where more concurrency stops helping, which deadlocks and long transactions repeat, and what the monitoring itself costs.
Instance reports run from the instance node in the tree, and Database reports run from a database node. Every report has a help page that explains the columns, the thresholds and what to do about what you find.
Workload and tuning
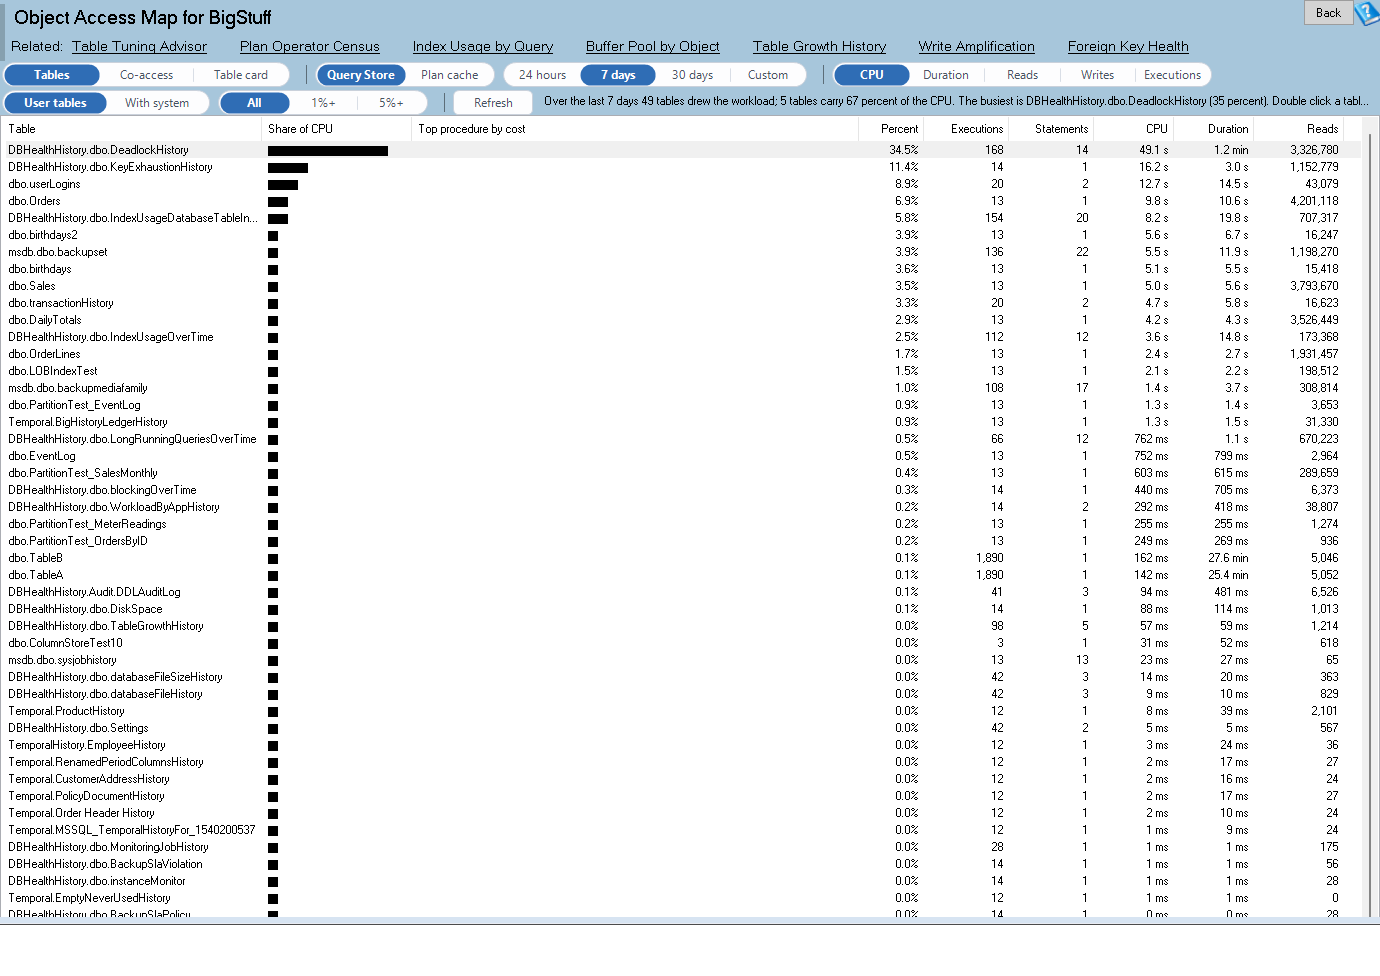
Most tuning tools rank statements. That is useful, but a table is touched by many statements, and the cost of a table is the sum of everything that touches it. Object Access Map is a Database report that attributes CPU, reads, writes and duration to every table each cached plan touches. It also builds a co-access matrix of the tables that appear in the same plans, so “what is Orders costing us and who else touches it” has an answer on one page.
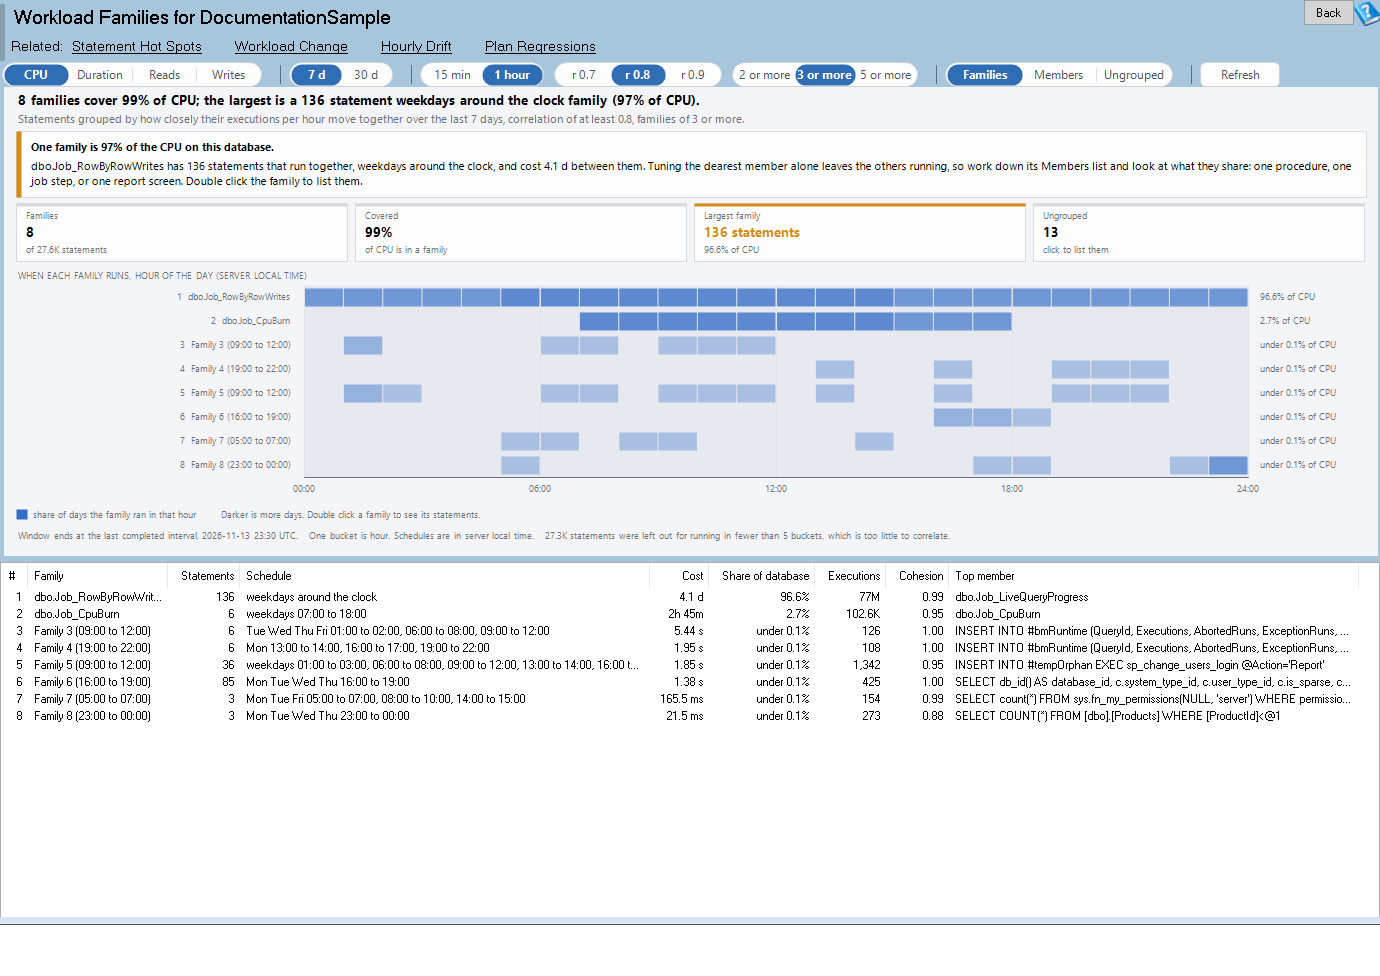
Workload Families groups the statements of a database by when they run rather than what they cost. The dozens of statements fired by one nightly load, one report screen or one integration poll show up as a single family with a total cost, a schedule and a member list. A family is usually the unit a person can actually reason about, and it is often the unit that someone owns.
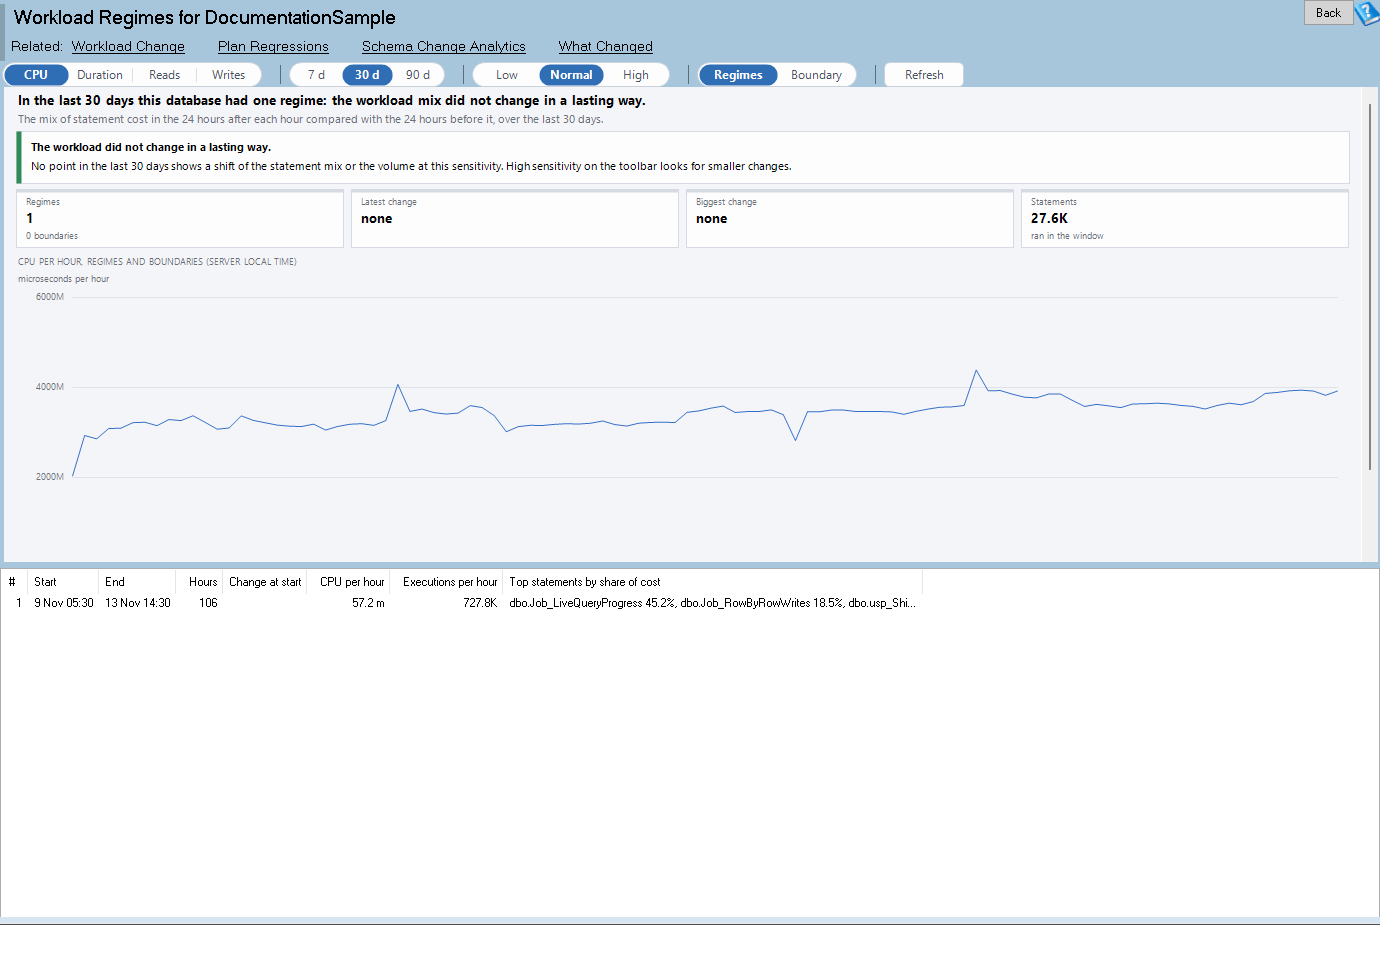
Workload Regimes looks for the moments a database started doing something different. A deployment, a new customer or a changed schedule all leave a mark in the hourly Query Store workload. The report finds those boundaries and presents the history as a few named regimes with the exact boundary and what changed. When someone says “it got slow sometime in the spring”, this is the report that turns that into a date.
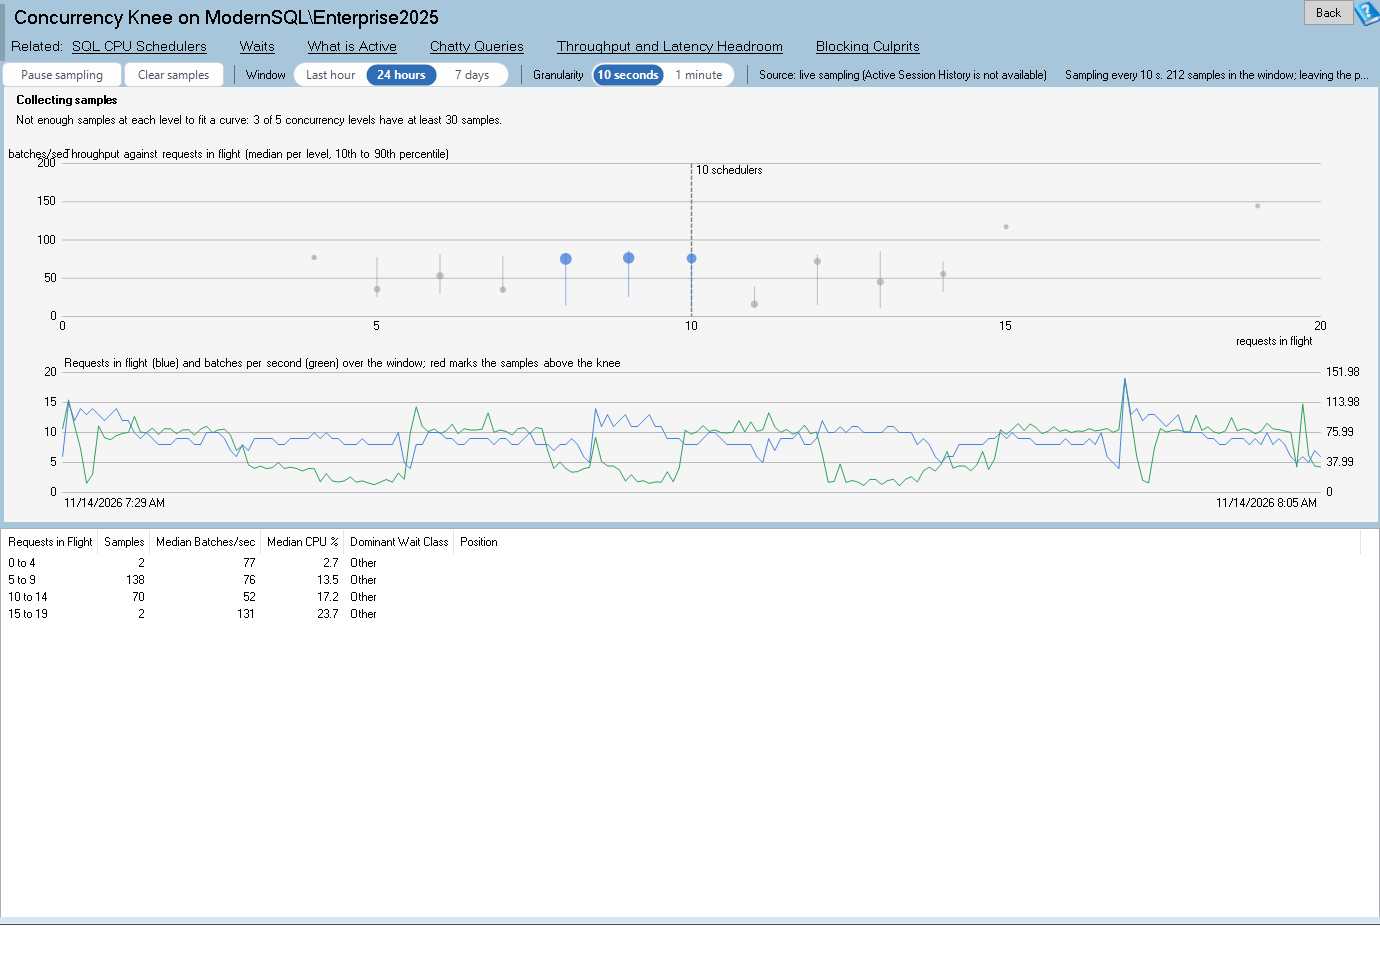
Concurrency Knee is an Instance report that plots requests in flight against batch requests per second. It finds the point where throughput flattens while concurrency keeps rising, and says whether the instance is limited by its own concurrency (queueing, blocking, CPU saturation) or by a lack of demand. That distinction decides whether the next step is hardware, tuning or nothing at all.
Burst Load Detector deals with the problem that five minute averages hide short spikes. The monitoring service samples a few counters every second and keeps only the seconds that exceed a ceiling or a multiple of their own normal. You can then see how many seconds an hour the instance was at its limit, and how much of that an average conceals.
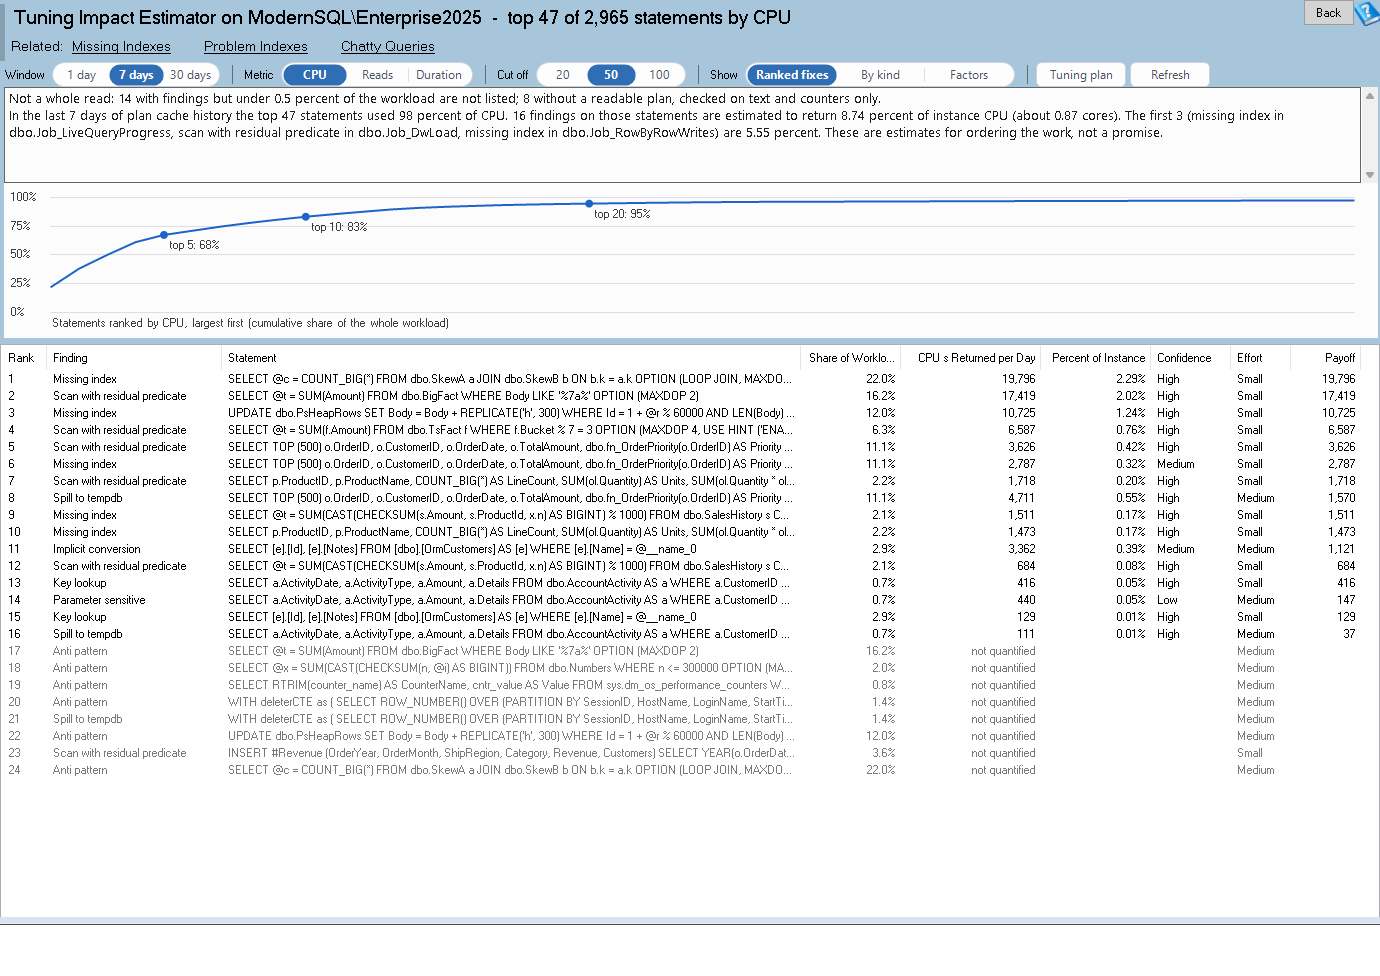
Tuning Impact Estimator starts by showing how concentrated the workload is: the share of CPU, reads and duration held by the top N statements. It then estimates what each fix the product already finds would give back in CPU seconds a day, ranked by payoff per hour of work. It is a way to choose the first thing to fix when there are fifty candidates.
Query Hint Census scans module text and cached statements for OPTION RECOMPILE, FORCE ORDER, MAXDOP, join hints and table hints. It shows where each one is, what it costs or hides, and whether the plan it produced is still the best plan Query Store has seen. Hints are often added in a hurry and never revisited, and this report is the revisit.
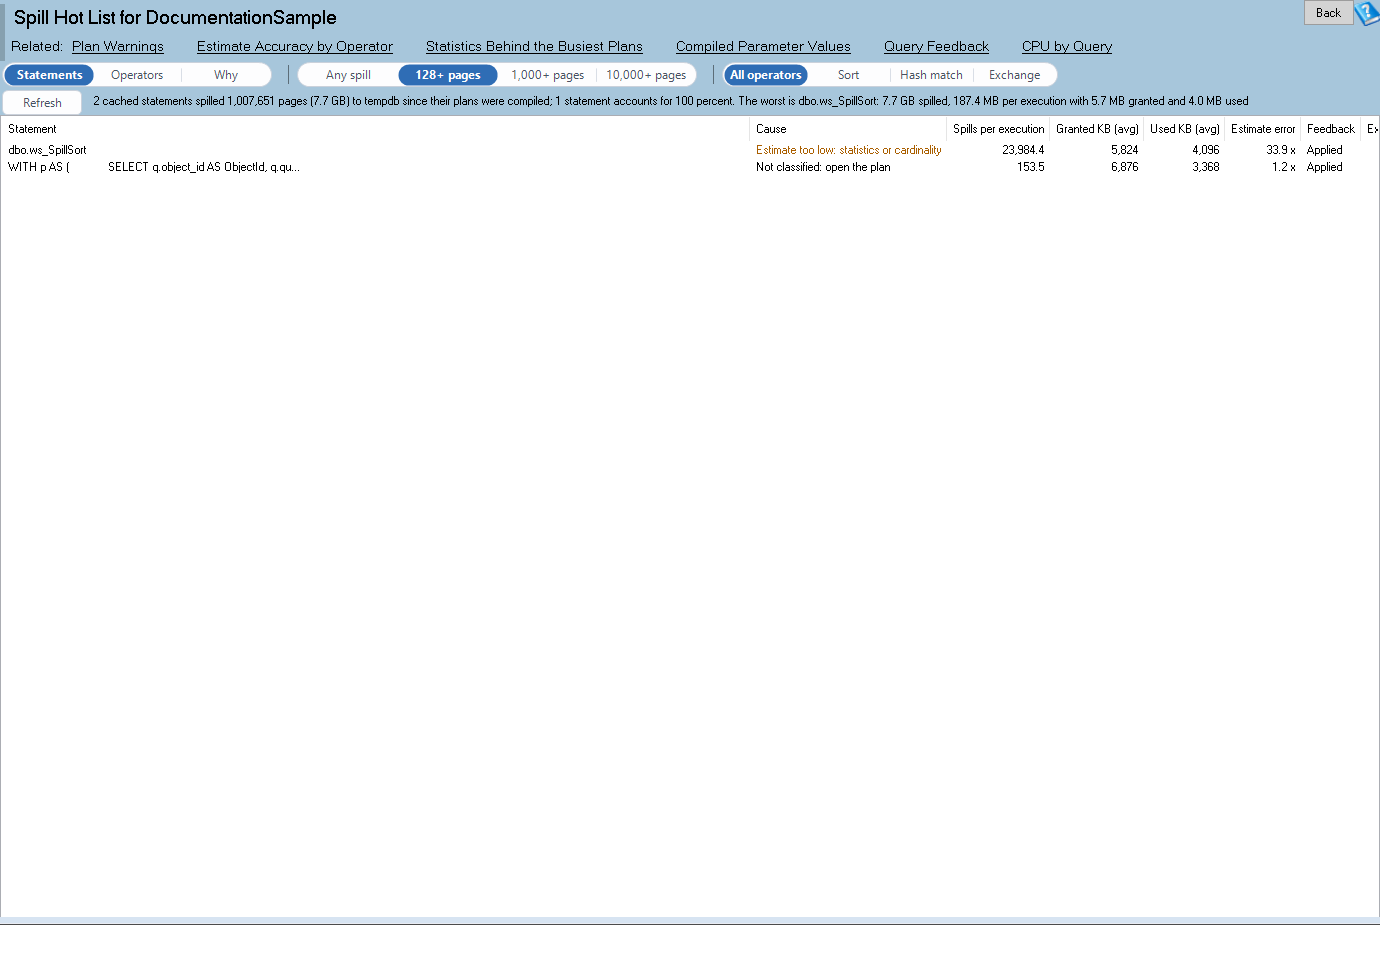
Spill Hot List ranks cached statements by the pages they spilled to tempdb and pairs each with its requested and granted memory, its estimate error and whether grant feedback has fixed it. The cause (a stale estimate, parameter sniffing or missing statistics) is named rather than left for you to guess.
Temp Object Usage Profile finds the statements and procedures that create temp tables and table variables and shows what each costs. It highlights table variable scans estimated at one row, temp tables created and dropped so quickly that metadata contends, and temp tables that force recompiles or cannot be cached.
Locking, deadlocks and monitoring
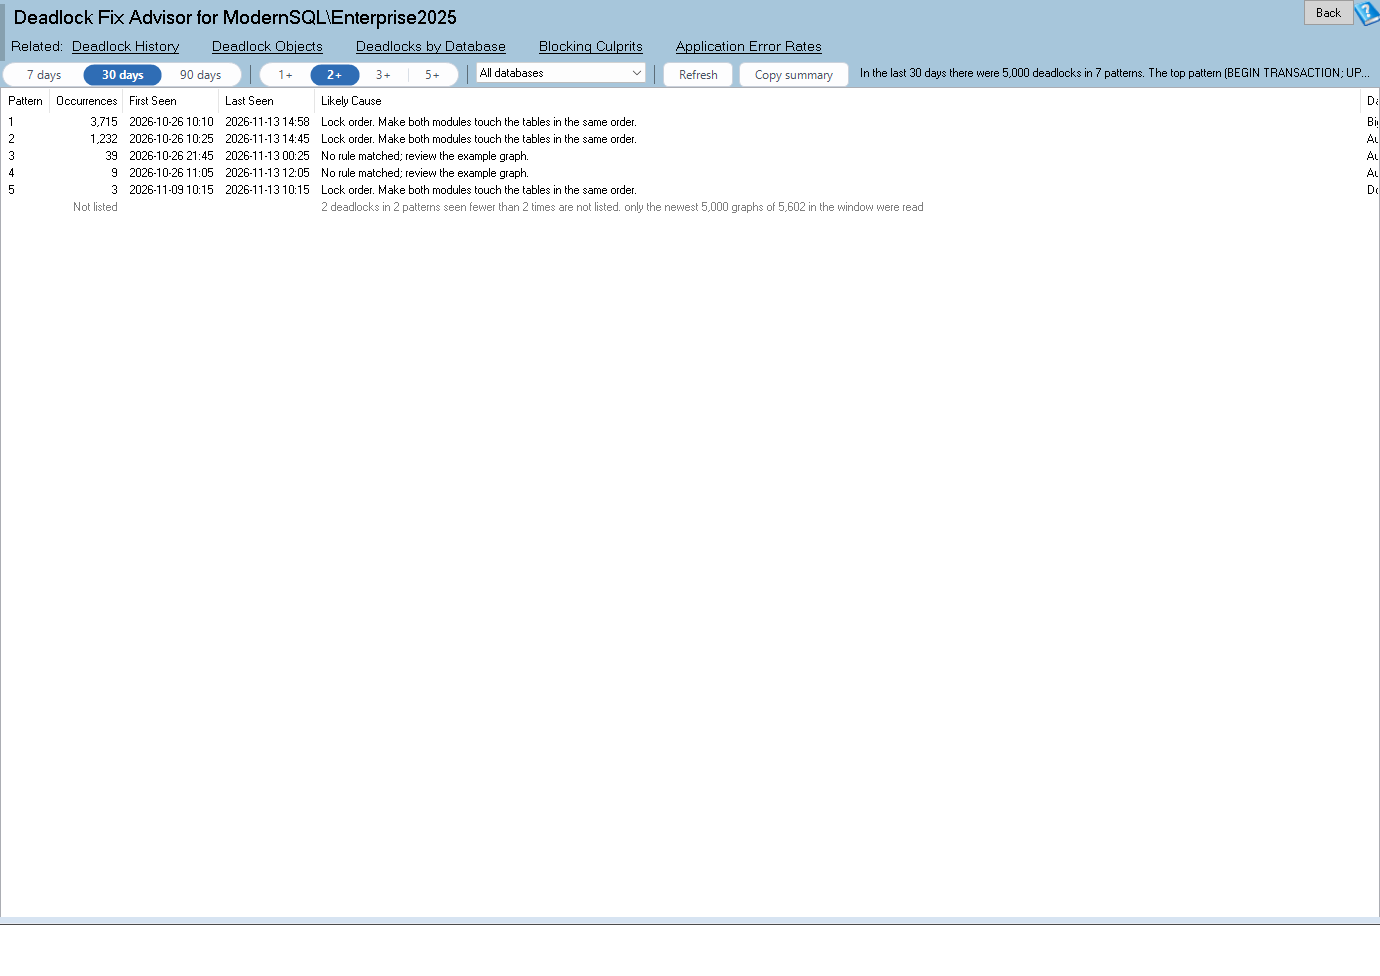
Deadlock Fix Advisor groups the stored deadlock graphs into recurring patterns by statement pair and resource. It counts each pattern and its victims, and states the likely cause and the cheapest fix for each: an index, a lock order change, an isolation level or a retry. Four hundred deadlock graphs become five problems.
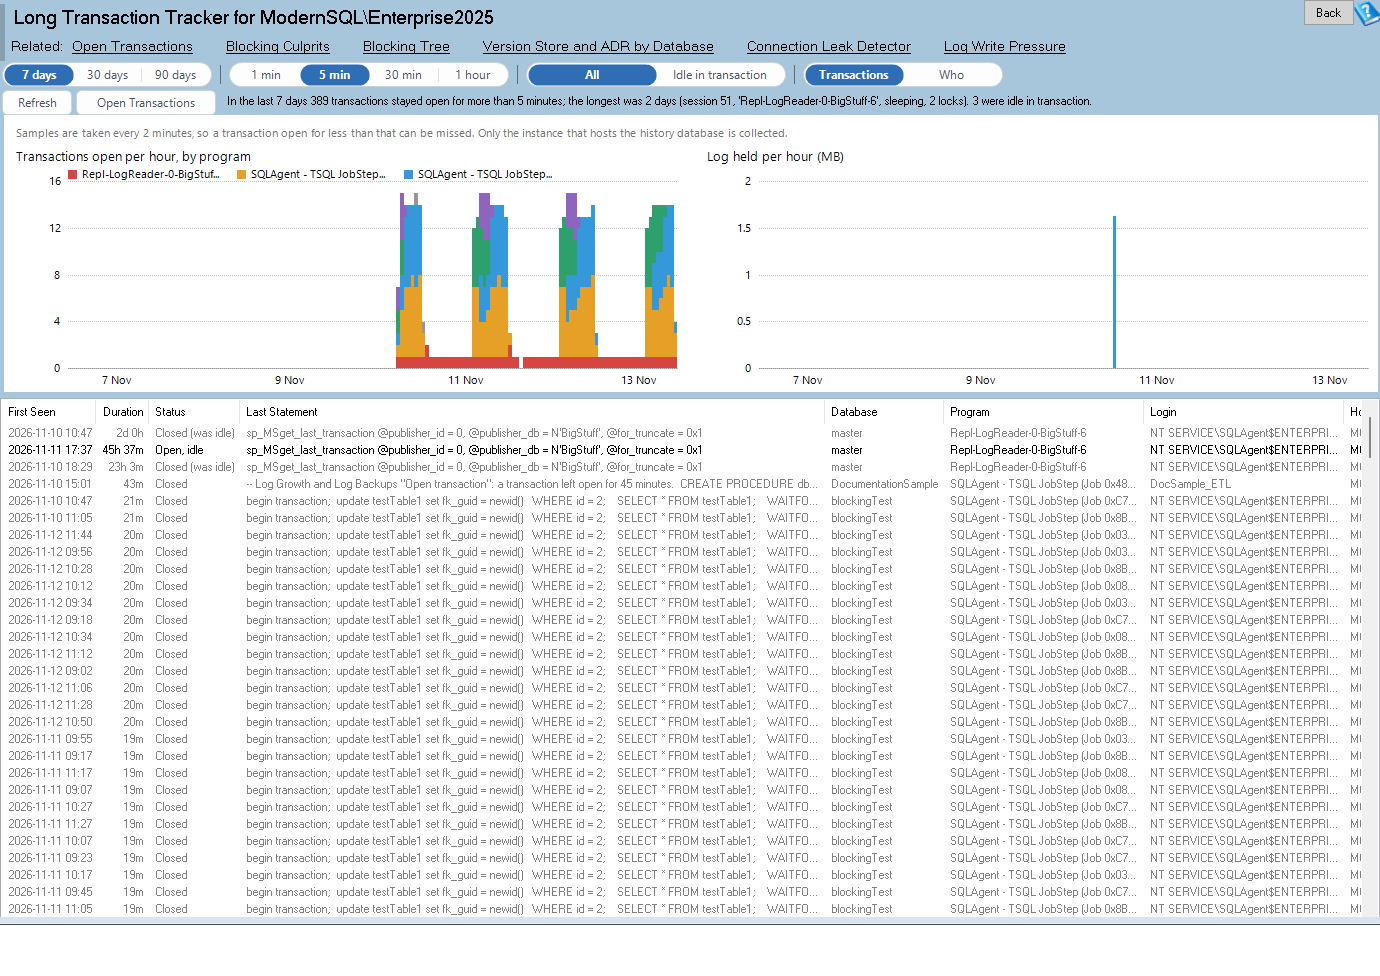
Long Transaction Tracker relies on the service. Once a minute it records every transaction open longer than a threshold with its session, program, login, duration, log bytes, lock count, blocked sessions and last statement, and it keeps the closed history. “What held that transaction open at 02:00” now has an answer the next day.
RCSI Readiness is a Database report for anyone considering read committed snapshot isolation. It measures how much of a database’s lock waiting is readers waiting on writers, which is the part RCSI removes. It finds NOLOCK and READUNCOMMITTED used as a workaround, and estimates the tempdb version store cost of turning RCSI on from the real write rate and the longest transactions.
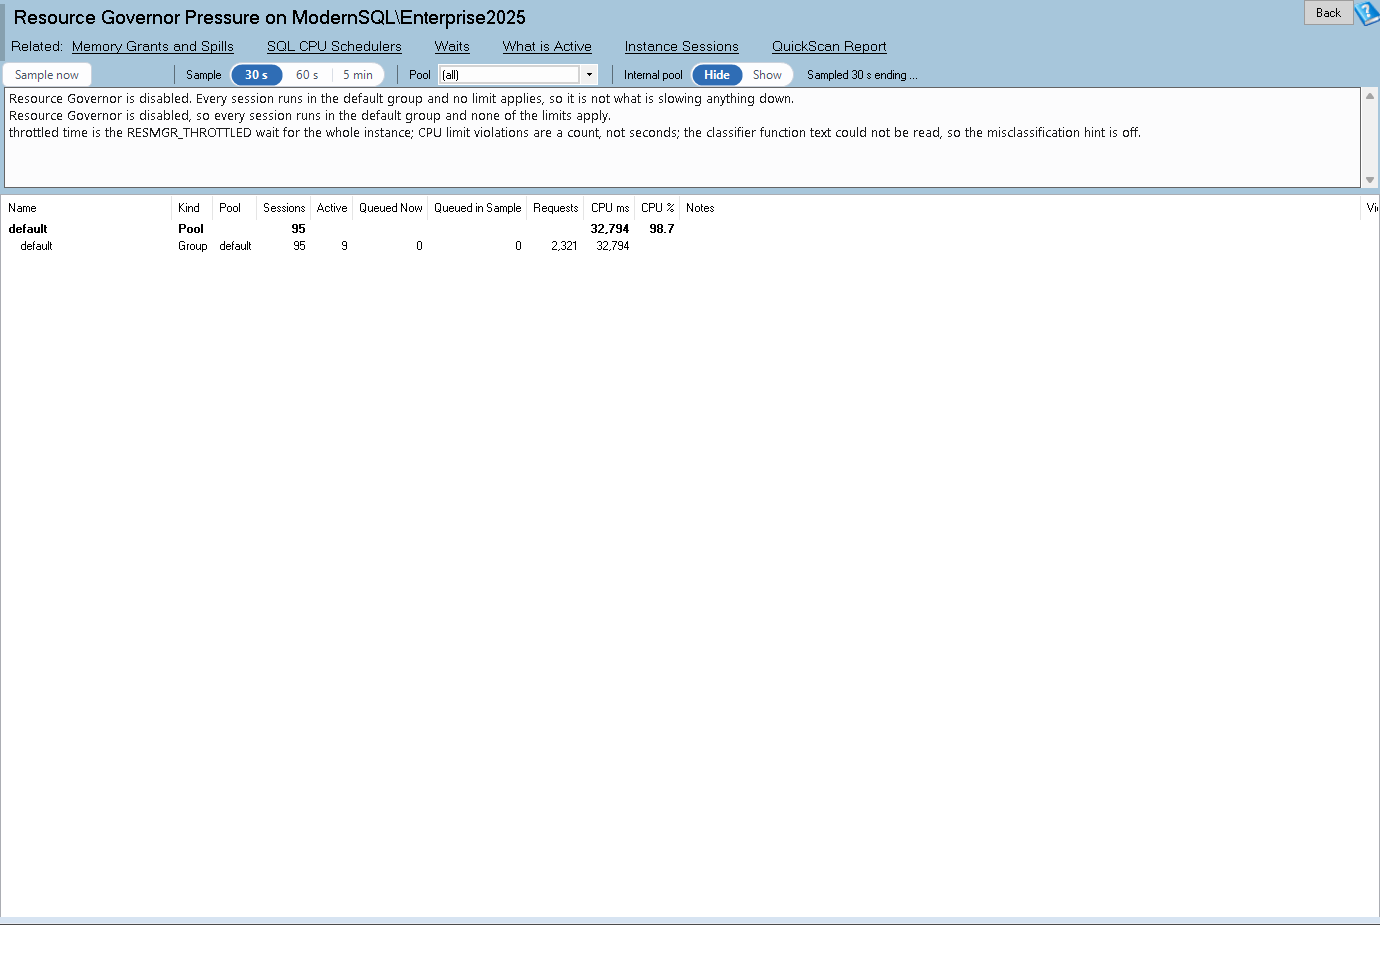
Resource Governor Pressure shows Resource Governor as a runtime picture. For each pool and workload group it shows CPU used against its limits, requests waiting on concurrency or grant limits, throttled time, and whether the classifier sends sessions where the design intended.
Application Error Rates reports the user errors SQL Server raises by error number, program, login, database and statement over time. It uses an opt in Extended Events session and keeps a baseline, so a spike in key violations, truncations, conversion failures or permission denials after a deployment stands out.
Alert Noise and Threshold Tuning scores every alert on how often it fires, how long it stays active, how often it flaps and whether anyone ever cleared it. It suggests a threshold from the metric’s own recorded distribution, so noise can be retired and thresholds tightened with evidence instead of opinion.
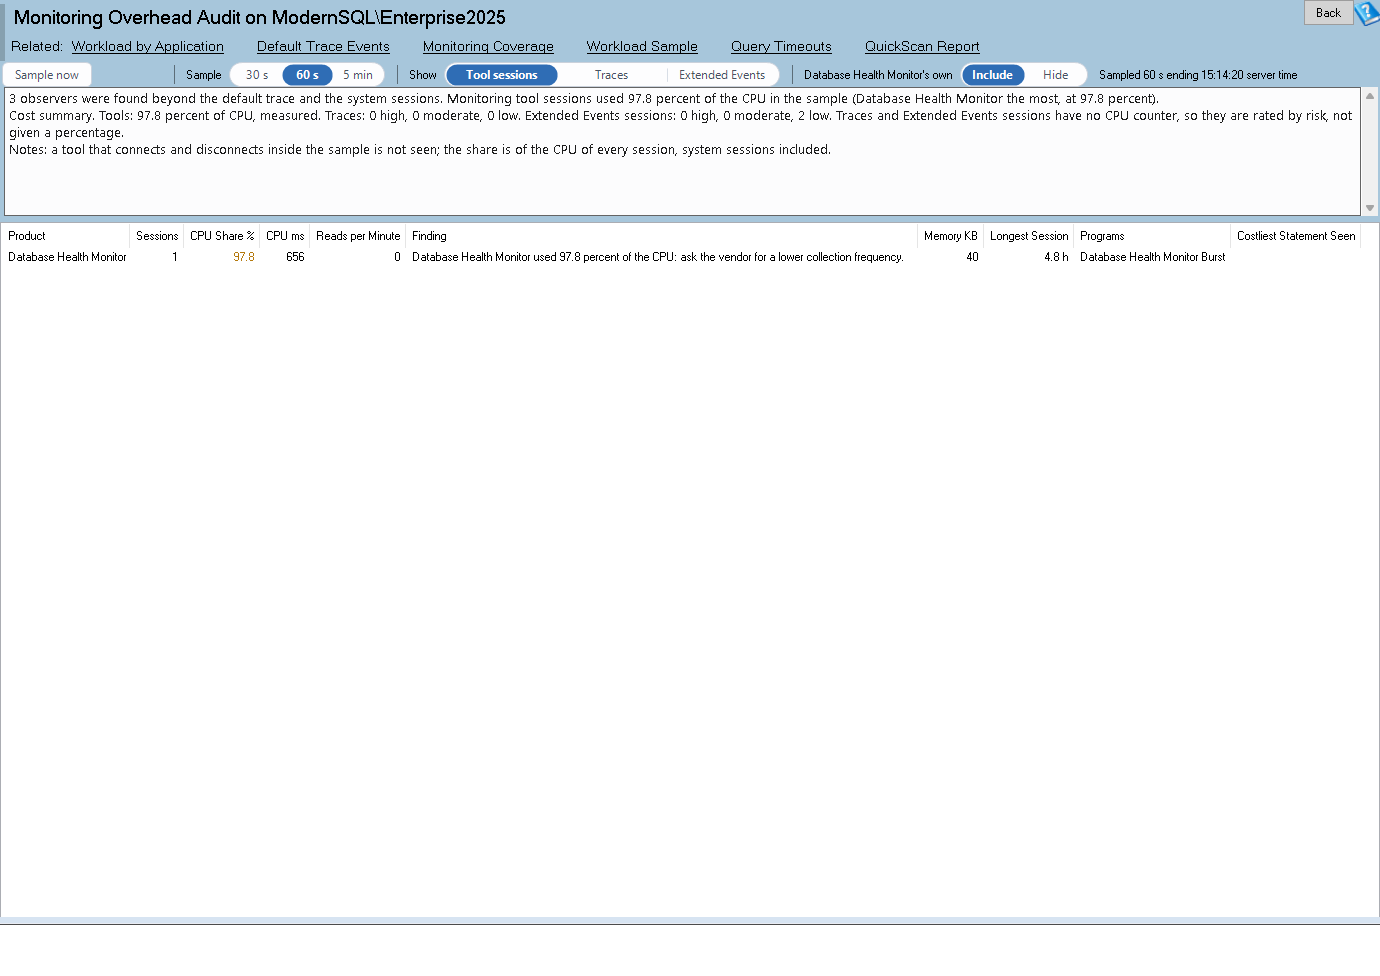
Monitoring Overhead Audit lists everything observing the instance: server side traces, Profiler and Extended Events sessions, and sessions that belong to known monitoring products. For each it shows the CPU, reads, memory and dropped events it costs. Observing a server is not free, and this report puts a price on it.
Hypervisor Contention Indicators detects a virtual machine starved by its host using only what SQL Server can see. It looks at the gap between CPU time and elapsed time, scheduler timing drift, clock skew, SOS_SCHEDULER_YIELD at low CPU and memory balloon signals. No vCenter access is needed, which matters when the virtualization team and the database team do not share logins.
Tables and indexes
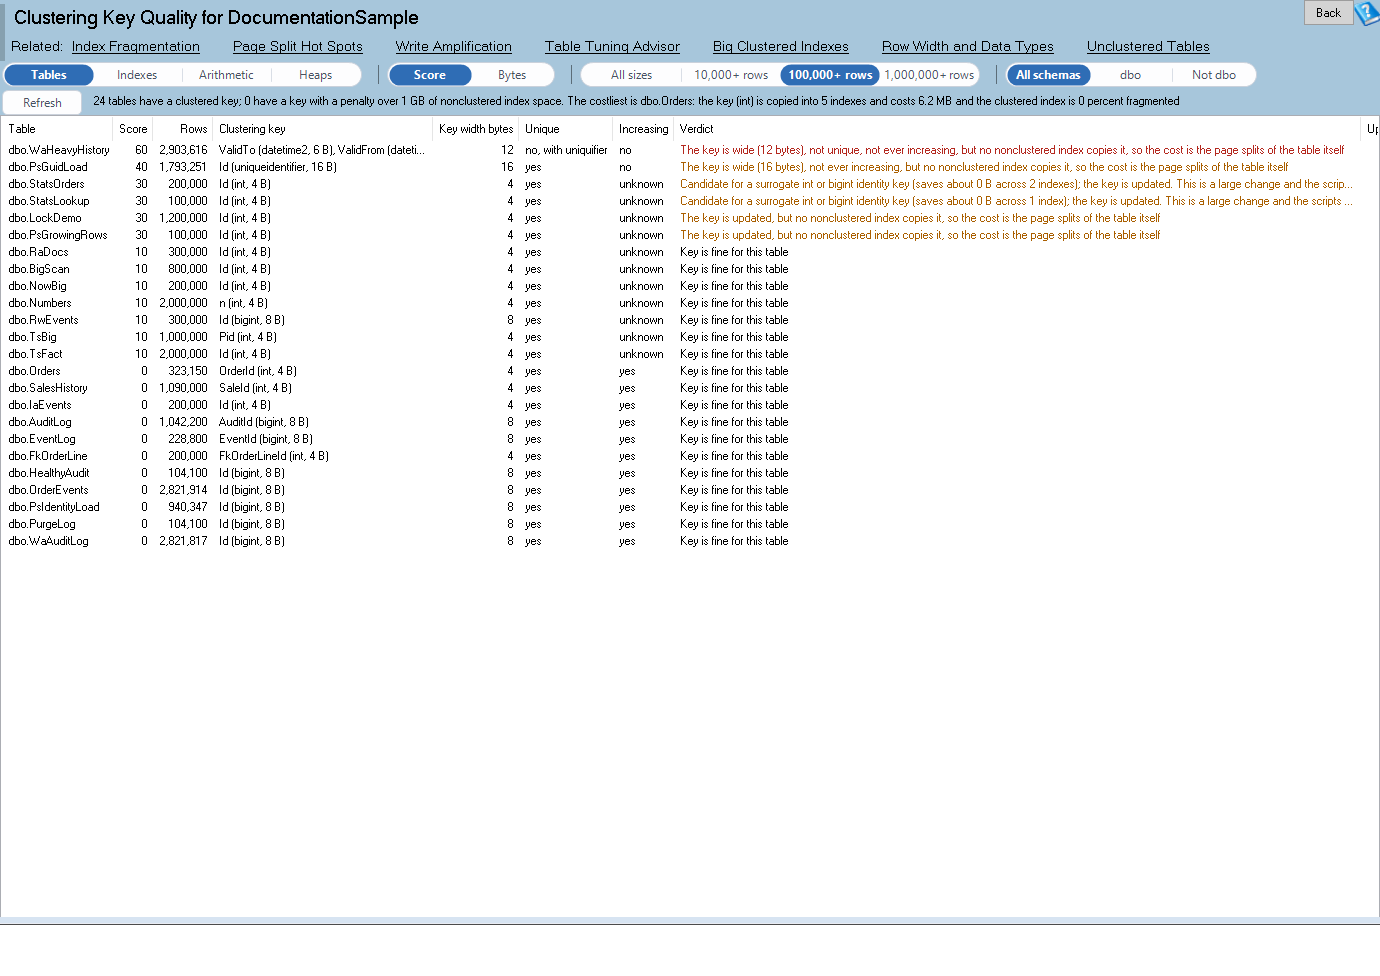
Clustering Key Quality scores every clustered index key on the four properties that decide its cost: narrow, unique, ever increasing and never updated. It prices the penalty in bytes copied into every nonclustered index, uniquifier overhead, page splits and key update cost.
Index Maintenance Effectiveness joins the index maintenance commands that actually ran with the fragmentation they recorded and the index’s real read activity. It uses the Ola Hallengren CommandLog when it exists and Agent job history otherwise. Rebuilds that repay their cost are separated from indexes rebuilt nightly that refragment within a day.
A much deeper Query Tuning Workbench
The Query Tuning Workbench gets the largest set of changes in this release, all aimed at reading a plan from every angle.
The comma separated warning names are replaced by a Warnings tab. Each warning is listed with its operator, severity, what it means, why it happens and ranked fixes, with a Try it button. A new Explain tab narrates the plan in plain language, which helps when the plan is large or when you are teaching someone to read one.
Where the time went shows, for each run, how the elapsed time splits between CPU and each wait type. When the run was blocked, it shows which session blocked it and what that session was running.
Compare now opens in its own resizable window. It draws both plans one above the other with every operator tagged and colored as costlier, cheaper, changed, new or gone. Clicking an operator on one side selects its partner on the other, the settings that differ are listed first, and the whole comparison can be copied as text.
There are more ways to read a plan as well: a sortable plan tree grid with estimate against actual, a flame style timeline, a click through operator details dialog, a third Cost by basis (reads) and a plan XML tab with copy and export.
The Table health and Cache tabs cover every table and index the selected plan touches. They show rows, size, fragmentation, forwarded records, statistics age, index usage and problem flags, and how much of each was cold or warm in the buffer pool. That is how a bad query is told apart from a neglected table. Finally, the Missing indexes grid has a Copy create script button that builds a CREATE INDEX statement with a readable name for the selected request.
The whole estate at once
Three new all instances reports each show one row per instance, read in parallel: Disk Space lists the volumes that hold database files, worst first. Security Posture shows the score with failed, manual and passed check counts. Encryption and TDE shows how many databases are encrypted and the days left on the certificate that expires first.
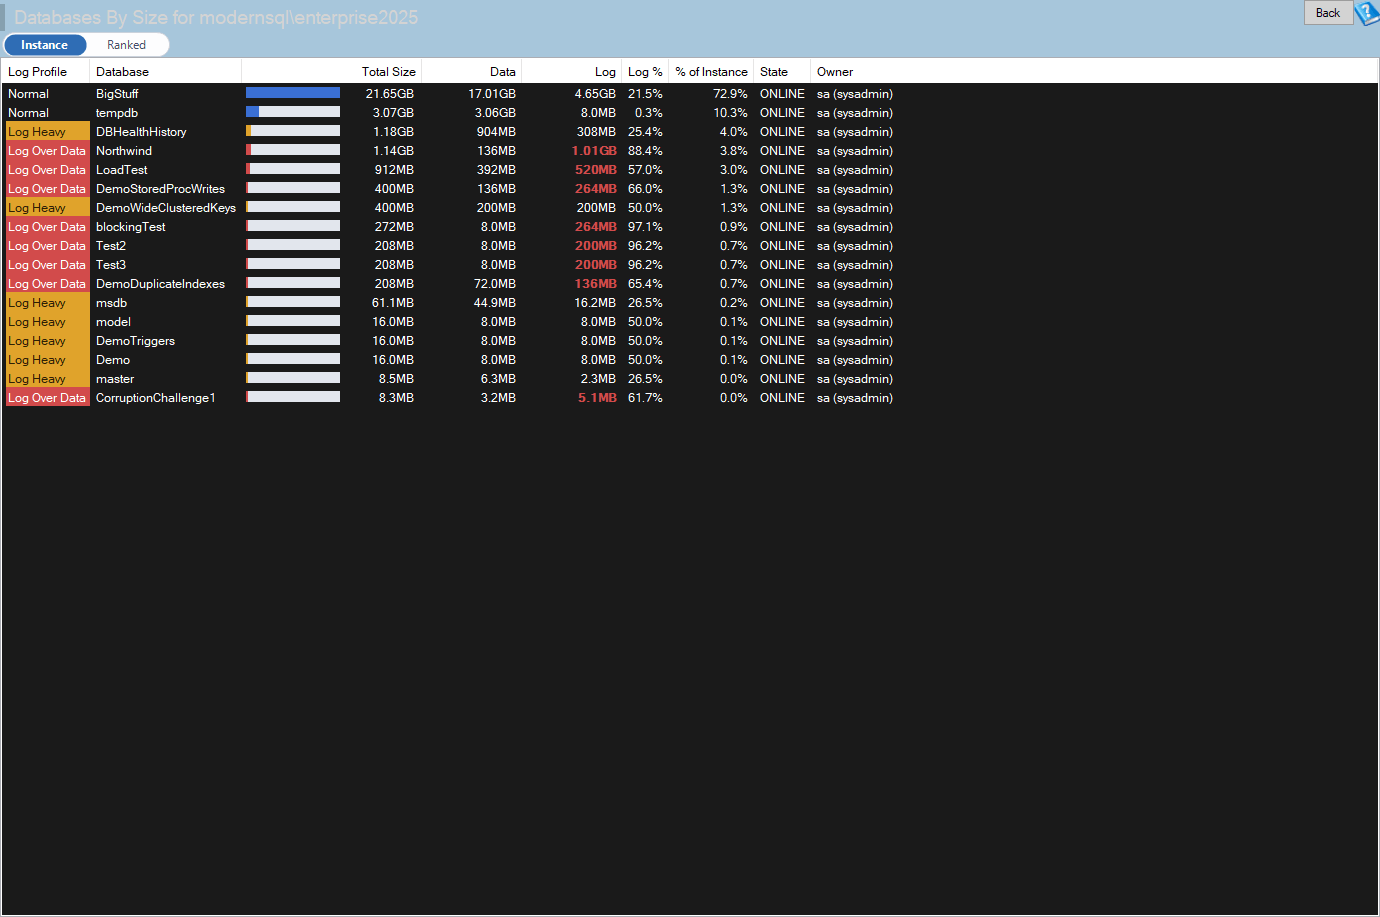
Database Use also gains an all instances view. The start page reports can be pinned and arranged by category: Backup and recovery, Storage and capacity, Jobs, Security, and Inventory and versions.
Charts, dashboards and reports
Event Overlay on Charts draws restarts, failovers, Agent job runs, backups, CHECKDB, schema changes, configuration changes, plan forcing and your own notes as markers and shaded bands on the time based charts. One legend toggles them. The cause of a spike becomes visible on the chart itself. A new help page explains it.
Dashboard report tiles also improved. Item lists that do not fit end with a muted “+N more” line, segments tiles color each OK category from the series palette so every block can be told apart, and item values carry their unit in every tile shape.
File Size Over Time was redrawn with straight segments instead of smoothed curves, a dot on each recorded period, and holes before a file’s first row and after its last collection. The chart now shows exactly what was recorded and nothing more. Table Growth History gets a right click item on the Large Tables grid and bars that opens the table’s own database page with the table selected, and the Performance Viewer Missing Indexes right click shows the queries behind a suggestion and every index on the table with an overlap classification, in one two tab dialog.
Alerting, checks and overview
The email alert dialog supports more filter rules, with RestrictTo wording that makes the filtering outcome clear. They were built first for alert 5006 Long Running Queries. Blank values are rejected, query text is matched after whitespace normalization, and legacy exclusions are kept.
Quick Scan has new service startup checks. Checks 9996 and 9997 flag a SQL Server or SQL Server Agent service that is not set to start automatically, and check 9998 is more compatible when testing whether the Agent is active. The Server Overview masthead also has a SQL Server Agent chip that shows whether the Agent is running or stopped, for editions that have an Agent.
Data Compare: set based synchronization
Data Compare gains a set based script style. It stages rows in chunks and applies one joined INSERT, UPDATE or DELETE per chunk, with a row count check and a matching rollback, in foreign key order. Apply directly bulk copies the differences and runs the statements with a permission precheck, a typed database name confirmation, a choice of transaction scope and a rollback script of before images. Every differing row can now be scripted whatever the display cap, large object values are read in full, and a headless mode (–style, –complete, –apply) is available for automation.
More than 1,200 fixes
More than 1,200 bugs were fixed in this release across Database Health Monitor, Azure SQL Health Monitor, Schema Drift, Data Compare, the Query Tuning Workbench, the monitoring service and the tray application, including 14 crash reports. The largest groups came from the code review sweeps of Schema Drift and the Query Tuning Workbench, followed by backup reports, dashboards, alerts, deadlock reports, Query Store, Space Recovery and Quick Scan checks, plus a pass over the help pages.
How the reports fit together
The 19 reports are not 19 separate ideas. They form a few chains that you can follow from a symptom to a fix.
Start with a slow afternoon. Concurrency Knee tells you whether the instance was limited by its own concurrency or by demand. If it was limited by concurrency, Burst Load Detector shows whether the seconds at the limit were rare spikes or a steady condition that a five minute average had smoothed over. Workload Regimes tells you whether the workload itself changed shape at about that time, and Workload Families names the group of statements responsible. Object Access Map then shows which tables those statements are fighting over, and Tuning Impact Estimator ranks what to do about it.
Start instead with a complaint about blocking. Long Transaction Tracker shows what held the transaction open and what it was waiting on. Deadlock Fix Advisor shows whether the same pair of statements keeps deadlocking. RCSI Readiness then tells you whether a database setting would remove most of the reader and writer waiting, and what it would cost in tempdb. Application Error Rates closes the loop by showing whether the errors that follow a deployment, such as key violations or timeouts, are part of the same story.
Start with a memory grant problem. Spill Hot List names the statements that spill and why. Query Hint Census shows whether a hint is forcing the bad plan, and Temp Object Usage Profile shows whether temp tables and table variables are the cause. Then take the statement to the Query Tuning Workbench, where Warnings, Explain and Where the time went show the plan from the operator level, and Compare shows what changed against the good plan.
Finally, there is a chain for the monitoring itself. Monitoring Overhead Audit shows what is watching the instance. Alert Noise and Threshold Tuning shows which alerts have trained everyone to ignore them. Hypervisor Contention Indicators answers the question of whether the problem is the database at all, or the host underneath it.
Who benefits most
A DBA who inherits a server gets the quickest return from Object Access Map, Workload Families and Clustering Key Quality, because those describe a database they have never seen. A consultant on a short engagement will like Tuning Impact Estimator and Index Maintenance Effectiveness, because both turn findings into ranked work with a payoff. A team that runs dozens of instances will notice the all instances reports for disk space, security and encryption, because each replaces a visit to every server. A developer will find Query Hint Census, Temp Object Usage Profile and the Query Tuning Workbench changes useful, since they explain in plain language what a plan is doing and what to change.
Getting version 4.1993
Download the installer from the Database Health Monitor site and run it over your existing installation. The new reports appear in the tree on their own, and the all instances reports appear on the start page with the others. If you use the monitoring service, the Burst Load Detector and Long Transaction Tracker begin collecting once the service has been updated, so give them a day before judging how much history they hold. The Application Error Rates report uses an opt in Extended Events session, so you choose whether to turn it on.
A good first hour with this release: open Object Access Map on your busiest database, run Tuning Impact Estimator on the instance, and check Monitoring Overhead Audit to see what else is watching the server. Those three together tell you where the workload spends its time, what is worth fixing first, and what the observers cost. Then open a plan in the Query Tuning Workbench and visit the new Warnings and Explain tabs.
Version 4.1993 is a release about understanding why a server behaves the way it does. Tell us which of the new reports you reach for first.