Custom Dashboards: Stop Opening Six Reports a Morning
Every morning you open the same reports on the same servers. Blocking on one, backup age on another, free space on a third, and by ten o'clock you have twenty tabs and no memory of which one showed 94 percent CPU. The cure is not one more report. It is custom dashboards that put those numbers side by side, so one glance does what a tour of tabs used to do.
How do I build custom dashboards to monitor SQL Server health? Custom dashboards in SQL Server monitoring put the numbers you check every morning on one screen: CPU, blocking, free space, backup age and more, for one server or all of them. Each widget is colored by limits you set, so a problem stands out without opening a single report.
Database Health Monitor builds these boards from widgets. A widget is a chart, a single number, a gauge, a list of statuses or a table of the worst offenders, and you place as many as you like on one screen.
Why the tab habit misleads you
Opening a report gives you one reading, taken now, of one server. That is a snapshot. A page life expectancy of 900 seconds looks fine until you know the same server sits at 4,000 every other Tuesday morning.
Worse, you are the alerting system. Nothing turns red when you are not looking. The report that would have shown the problem is the one you skipped because you were short on time.
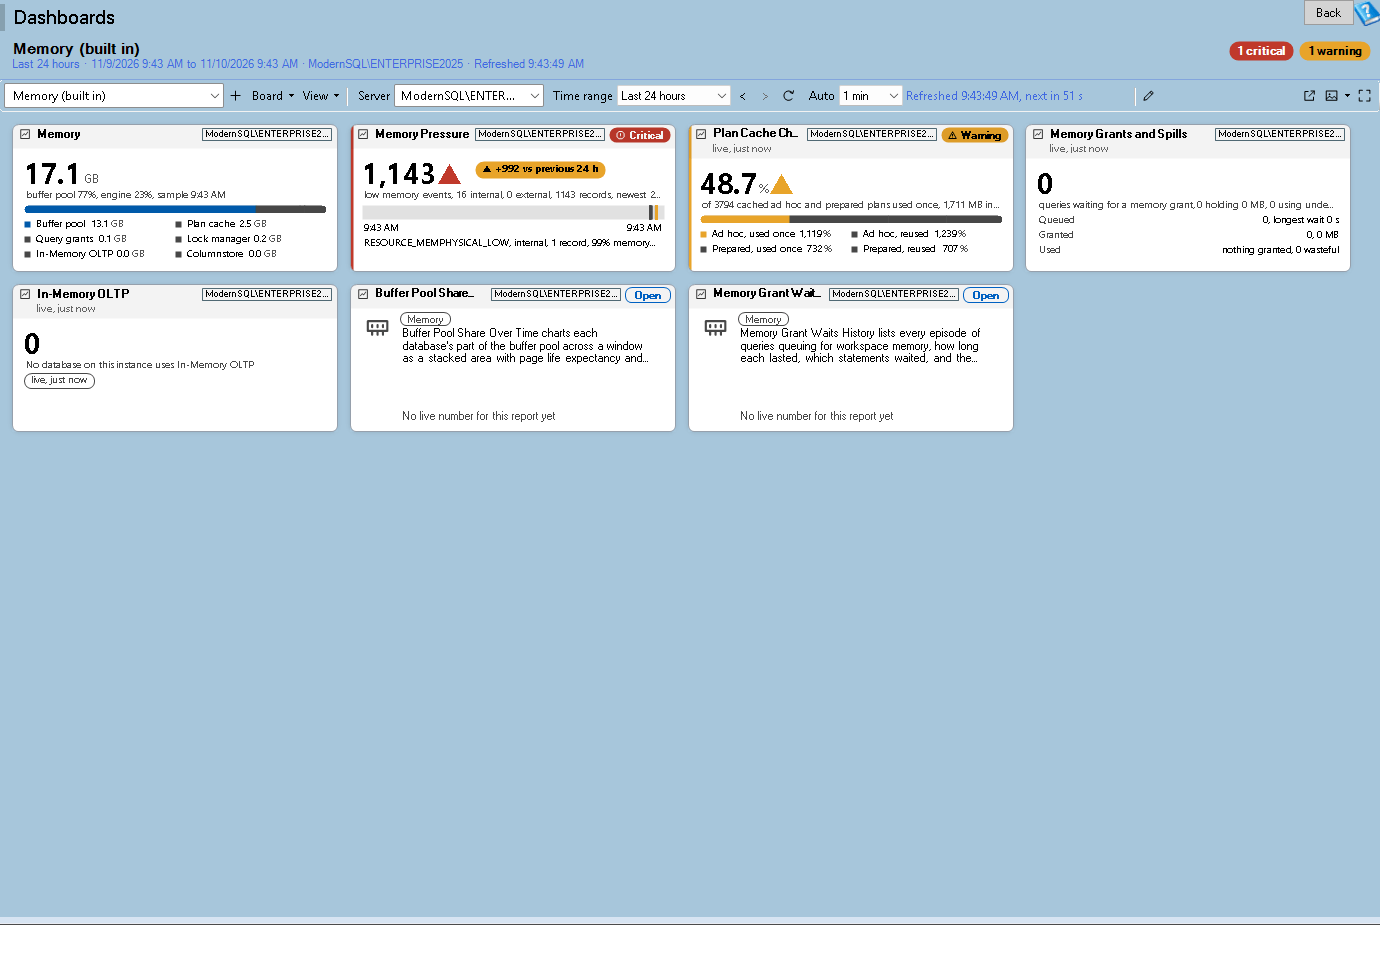
Dashboards is one of the reports in Database Health Monitor. It runs against your own servers, and it takes about a minute to have this same screen open on one of them.
Measure against limits and against normal
A bare number needs context before it means anything. Each data widget carries an amber limit and a red limit, and the tile draws a left stripe and a pill in that state. Zero is a legitimate limit, so the field is optional rather than defaulted.
Limits are blunt, though. A server that idles at 5 percent CPU and jumps to 60 is in trouble long before any fixed threshold fires. So a tile can also be judged by its normal range: the band from the 10th to the 90th percentile of the same clock hours across the previous four weeks. When the newest sample falls outside it, the tile is marked unusual and the header reads something like "unusual since 10:15".
Two more honesty checks are built in. A value whose newest sample is older than the collection interval allows is marked stale, with its age in the subtitle, so you never trust a number from a stopped collector. And a chart hatches the stretch before history began and any gap where nothing was collected, rather than drawing a confident line across it.
What custom dashboards put on screen
The widget types cover most of what you would otherwise open a report to see:
- Time series chart: up to 8 lines, amber and red rules, events such as restarts and deadlocks on a strip underneath, and your own annotations pinned to a moment.
- KPI tile: one number with a delta against the previous period, a sparkline, and for size metrics a Time to limit layout that counts the days until the projection runs out.
- Punch card: deadlocks or alert emails per hour as a day by hour grid, where "every weekday at 02:00" shows up as a dark vertical stripe.
- Top N table: the slowest queries or the fullest drives, with a click that opens the report behind the row.
- Text note: a runbook, contacts, or a checklist with real tick boxes that survive a restart.
The metric list holds 33 history metrics in six groups, plus a Live group read straight from the instance: sessions, blocked sessions, CPU now, page life expectancy now and batches per second. Live tiles poll every 10 to 30 seconds over one pooled connection named "Database Health Monitor (dashboard)", so you can spot the cost in a login trace. A login without VIEW SERVER STATE gets a plain permission message on the tile instead of a blank.
Forecast the disk before it fills
Turn on Forecast to limit for a size, free space or percent used chart and the board fits a straight line through the window, then extends it as a dotted line to the point where the series runs out. The hover might read "at this rate: 0 GB free on Nov 23". It is a projection, not a promise, and the screen says so each time it appears.
Nobody budgets for the log that grew every night for a month. A line that crosses zero in nine days does the budgeting for you.
One board for the whole estate
A widget can be about one server, every registered server, an environment tag such as Production, or a hand picked set. The heat map draws one cell per server, colored by the metric's limits. The estate matrix puts servers down the side and two to eight metrics across the top, so CPU, page life expectancy, blocked sessions, oldest full backup and oldest CHECKDB become a single grid you can sort by worst row first.
Limit profiles let a Production server be judged more strictly than a Test server on the same board. A gray cell means that server has no history or did not answer, which is information in itself.
You do not need to build from scratch. Built in boards cover Estate Overview, Server Detail, Storage, Live, Availability Groups and Replication, each with a server selector so one board works for any instance. They are read only, so duplicate one and edit the copy.
Keep it where you will actually see it
A board nobody looks at is another unopened report. Three features fix that. A pop-out window keeps the board in a slim, always on top frame, and its Ticker mode shrinks it to a single row of pills for only the critical, warning and unusual tiles. Full screen wall mode rotates boards on a monitor, and DatabaseHealth2.exe /wall starts it at launch for a kiosk. And scheduled snapshots draw a PNG or PDF of chosen boards at 1920 px wide on a schedule, with the program closed if you run DatabaseHealth2.exe /snapshot from a Windows scheduled task.
To cut noise, a worsened tile can toast or toast with sound, with quiet hours and a setting for how many refreshes must pass before it notifies, so a tile flapping between warning and OK does not nag you. Printing and PDF export are covered on the Printing and Saving as PDF page.
One caution. History metrics, Top N tables and the event strip need the history database on that server. Live tiles and report summary tiles read the instance and work without it. If several servers write to one shared history database, some tiles say "Not per server" rather than show the same number everywhere, so give each server its own.
The full reference for every widget, menu and shortcut is on the Dashboards help page. Start with a duplicate of Estate Overview, and see which of your morning tabs you no longer open.
What to check on your own server
- List the five numbers you check first every morning, such as CPU, blocked sessions, free space, oldest full backup and oldest CHECKDB
- Set an amber and a red limit on each of those numbers instead of judging them by eye
- Judge a metric by its normal range as well as its limits, so a quiet server that suddenly runs hot shows up
- Add a forecast to limit line to your drive free space chart and note the date it reaches zero
- Duplicate a built in board, save the copy, and pop it out so it stays visible while you work
Try Database Health Monitor Today
Replaces the morning tour of a dozen reports and servers with one board that colors itself by the limits you chose. Database Health Monitor shows it on every instance you connect, in the time it takes to open the report.
Download Database Health Monitor and run the Dashboards report against your own server. There is nothing to configure first, and you will know inside a few minutes whether it tells you something you did not already know.