10 SQL Server Metrics to Monitor for Performance

10 Essential SQL Server Metrics to Monitor for Optimal Performance
When it comes to managing SQL Server Performance, there are many metrics that need to be monitored continuously to ensure smooth operations. Ignoring these critical metrics can lead to slow response times, bottlenecks, or even system outages. In this blog post, we’ll highlight the top 10 performance metrics you should track, and how Database Health Monitor can make this process easier.
Top 10 SQL Server Performance Metrics
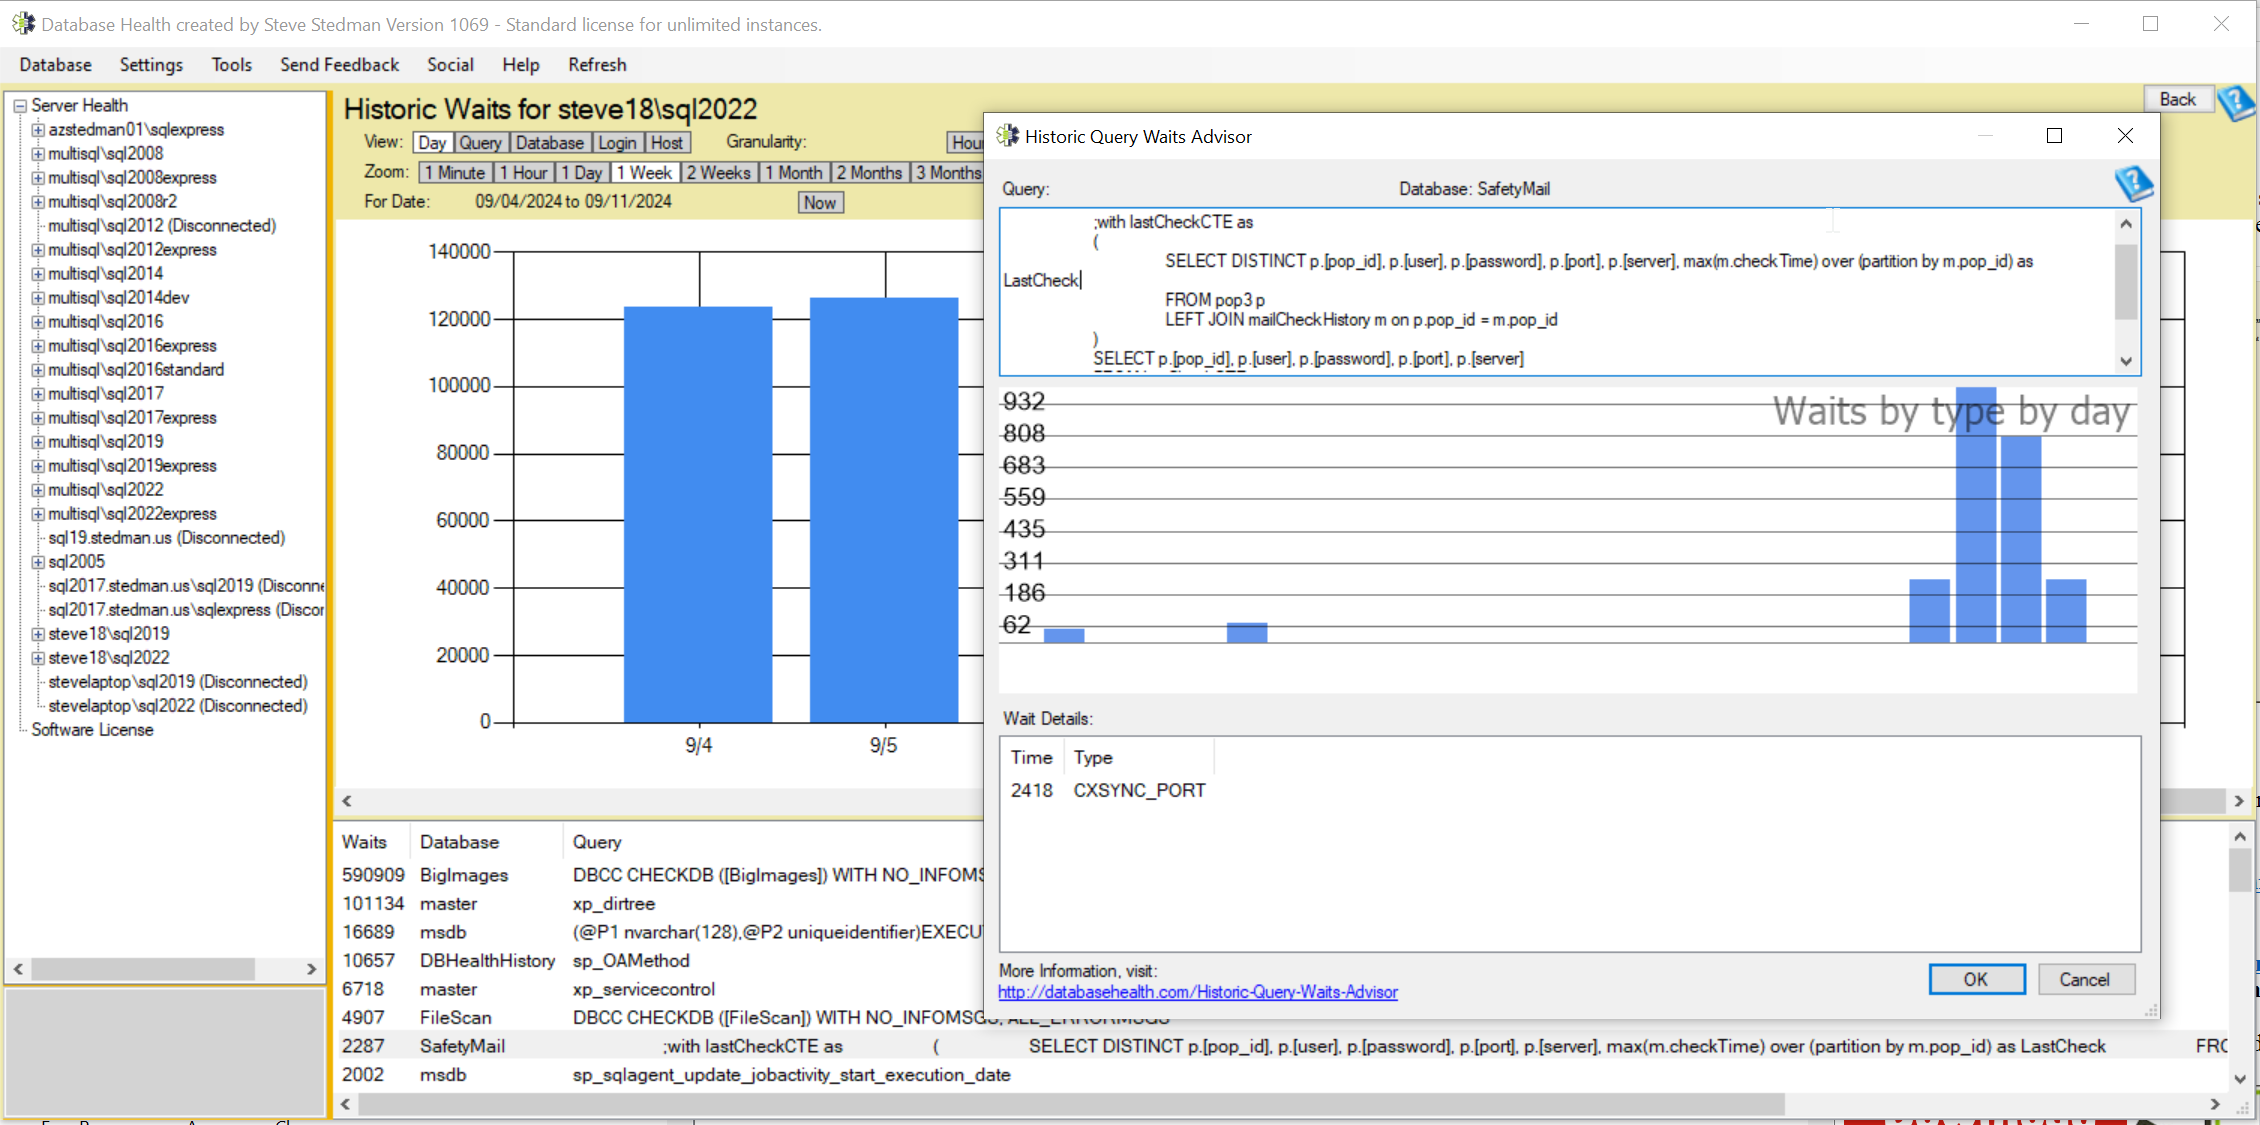
- Wait Statistics
- What: Monitor SQL Server wait types to identify where processes are spending the most time waiting.
- Why: Helps pinpoint bottlenecks related to CPU, I/O, memory pressure, locking, or network issues.
- How Database Health Monitor Helps: Provides detailed analysis of Wait Statistics, allowing you to easily identify problem areas.
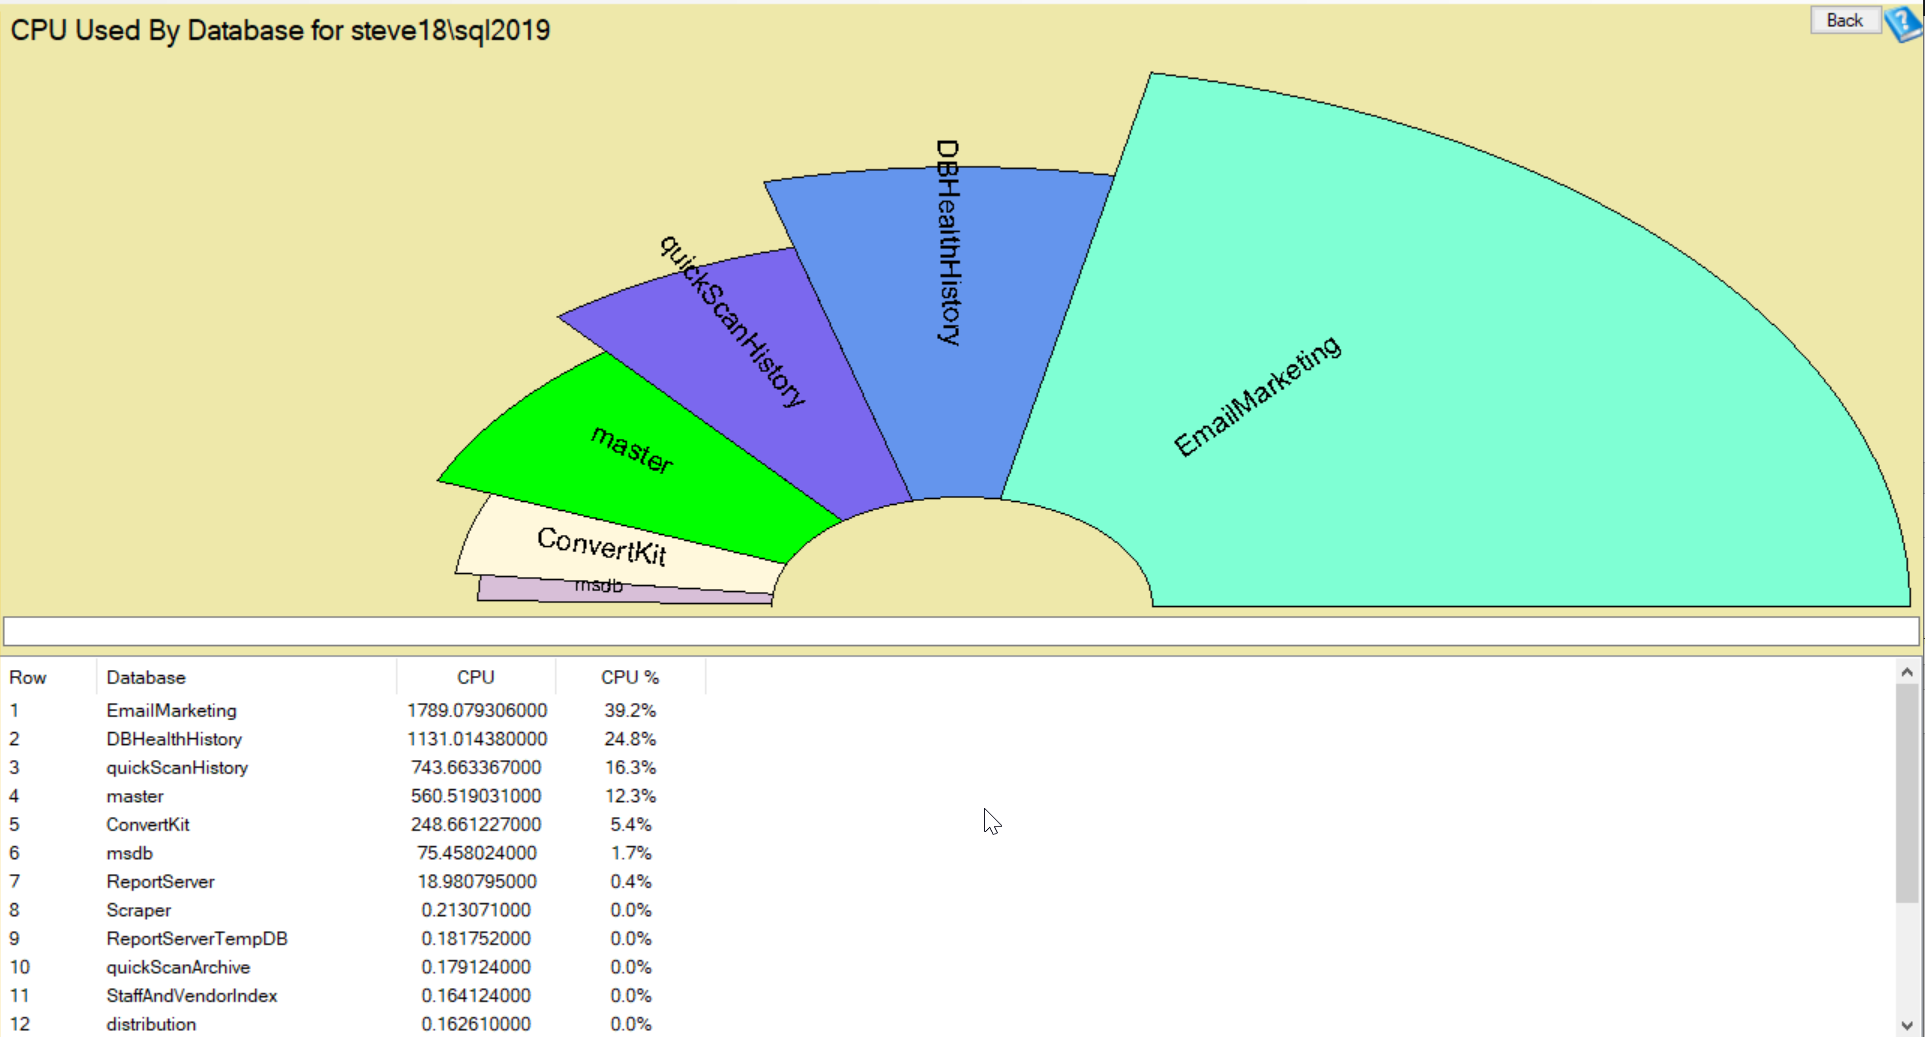
- CPU Utilization Blocking and Deadlocks
- What: Track the percentage of CPU usage by SQL Server, including individual queries.
- Why: High CPU usage often signals inefficient queries, missing indexes, or heavy workloads.
- How Database Health Monitor Helps: Offers real-time CPU utilization insights, helping you spot CPU spikes and drill down to the queries causing them.
- Memory Usage
- What: Monitor memory allocation for buffer cache, procedure cache, and memory grants.
- Why: Memory pressure can lead to more disk I/O and slower query performance.
- How Database Health Monitor Helps: Monitors memory usage, alerting you when there are potential memory bottlenecks or allocation issues.
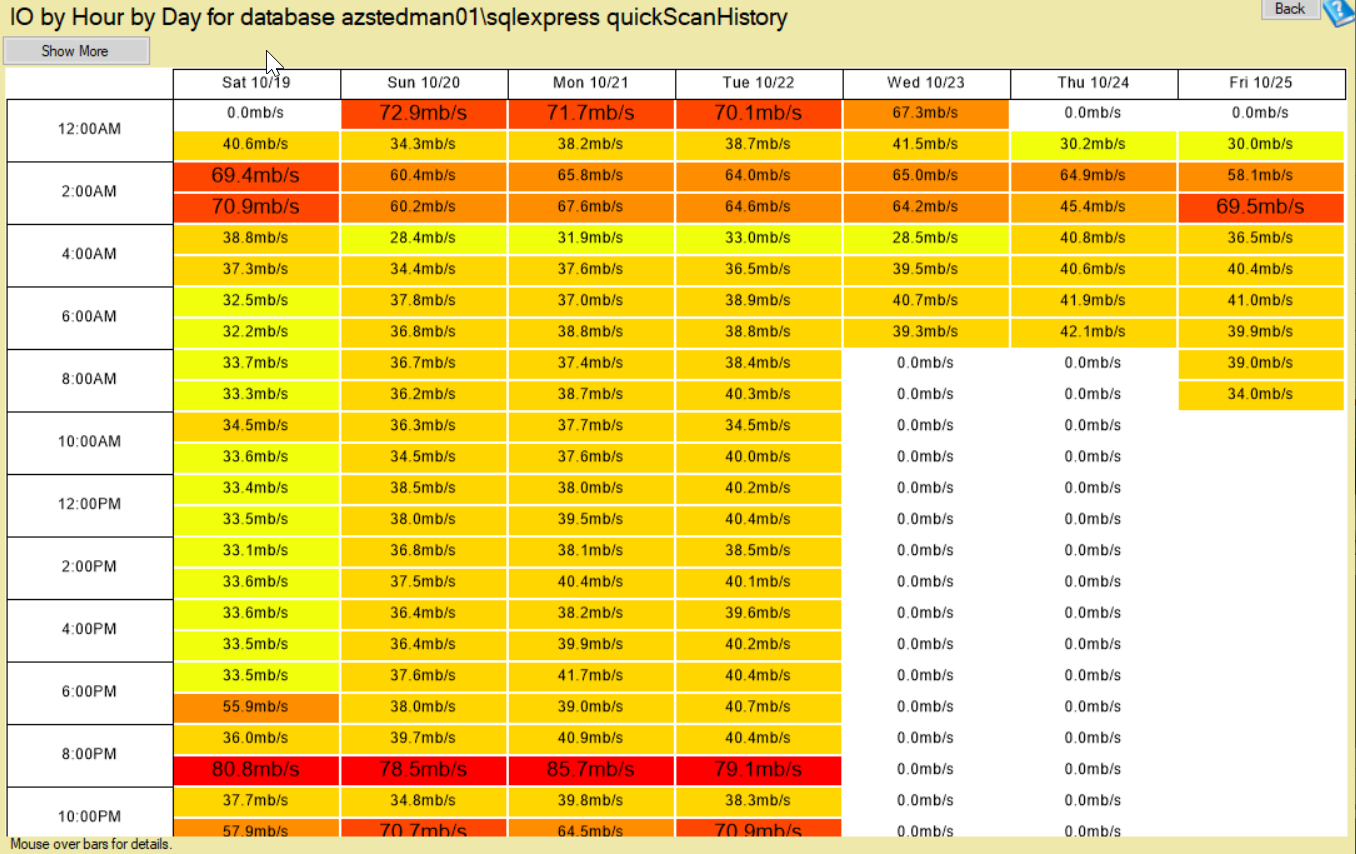
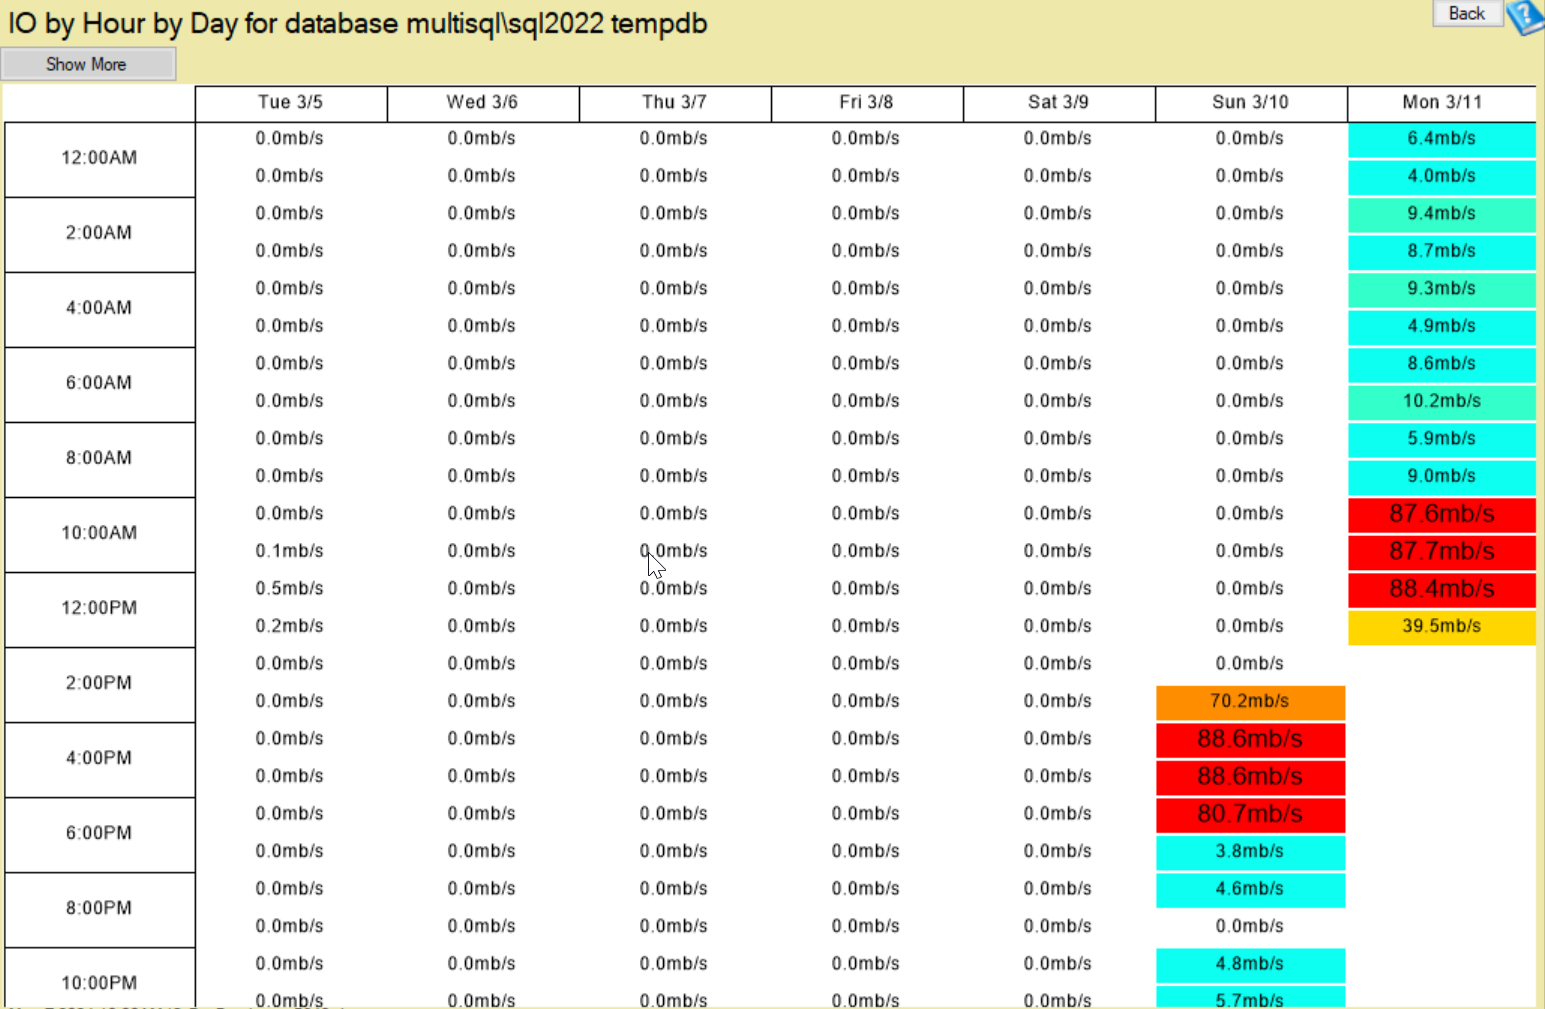
- Disk I/O (Reads/Writes)
- What: Analyze read and write latency on disks where SQL Server databases and transaction logs reside.
- Why: High I/O latency can slow down data operations, impacting overall performance.
- How Database Health Monitor Helps: Tracks disk I/O metrics, highlighting high-latency events to assist with root-cause analysis.
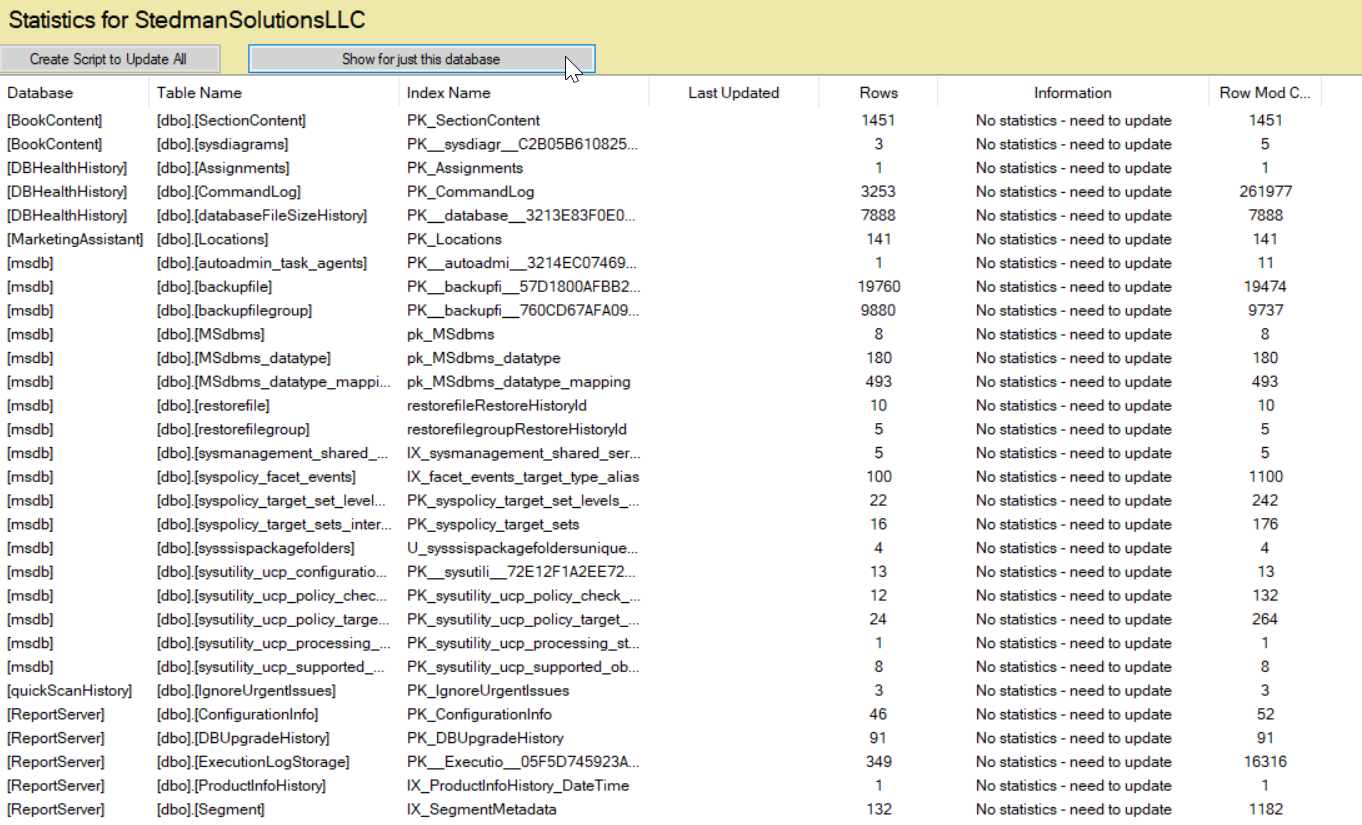
- Out-of-Date Statistics
- What: Track the age and accuracy of query statistics on tables and indexes.
- Why: Out-of-date statistics can lead to inefficient query plans, slower execution, and suboptimal performance.
- How Database Health Monitor Helps: Identifies out-of-date statistics and suggests updates to ensure better query optimization.
- Query Execution Time
- What: Measure how long queries take to complete, identifying the slowest-running ones.
- Why: Finding slow queries helps prioritize tuning efforts to improve overall response time.
- How Database Health Monitor Helps: Tracks execution time, providing a list of the longest-running queries to aid in query tuning.
- Blocking and Deadlocks
- What: Monitor for blocking sessions and deadlock occurrences.
- Why: Blocking can cause delays, while deadlocks result in failed transactions that need to be resolved.
- How Database Health Monitor Helps: Alerts you to blocking and deadlocks, helping you to quickly resolve conflicts and maintain smooth operations.
- Page Life Expectancy (PLE)
- What: Track how long data pages remain in memory before being flushed to disk.
- Why: Low PLE indicates memory pressure, which forces more disk reads and degrades performance.
- How Database Health Monitor Helps: Monitors PLE trends, providing early warning of memory pressure and its impact.
- TempDB Contention
- What: Monitor TempDB usage, growth, and contention.
- Why: TempDB is critical for handling large queries, temp tables, and other operations; contention can severely impact performance.
- How Database Health Monitor Helps: Tracks TempDB usage, helping you identify contention points and optimize TempDB settings.
- Network Latency
- What: Measure network latency and bandwidth between SQL Server and clients.
- Why: High network latency can slow down applications that rely on real-time data processing.
- How Database Health Monitor Helps: Monitors network latency, providing visibility into data transfer times and potential network issues.
By using Database Health Monitor, you can automate the monitoring of these crucial performance metrics. The tool offers real-time insights, historical tracking, and alerts, enabling you to identify and resolve issues before they impact your environment.
Want to make monitoring even easier? Consider our Managed SQL Server Services, where we handle Performance Tuning, maintenance, and proactive support for you. Our expert team keeps your databases running smoothly, giving you peace of mind.



Leave a Reply