SQL Server Table Use Report: Track Last Queried Tables in Database Health Monitor
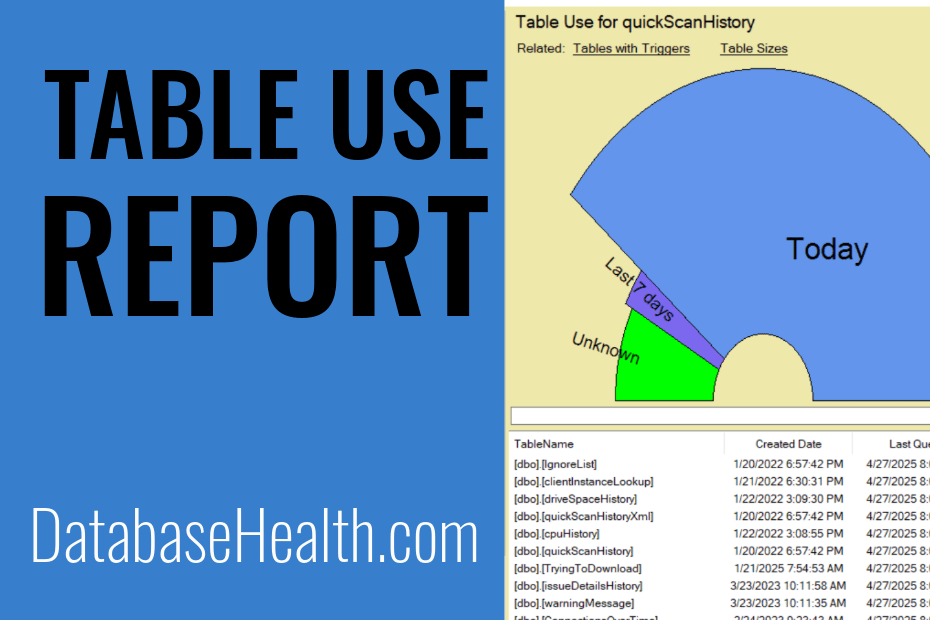
In today’s data-driven landscape, SQL Server databases form the backbone of countless business applications, handling everything from real-time transactions to long-term analytics. Yet within these complex systems, tables vary widely in their activity levels—some see constant queries while others sit idle, quietly consuming storage and complicating maintenance. Gaining clear visibility into actual table usage patterns is essential for improving performance, controlling costs, and strengthening security.
The Table Use Report in Database Health Monitor addresses this need by capturing the last queried timestamp for every table, delivering both visual summaries and detailed breakdowns that help database professionals identify high-activity tables, spot unused ones, and make informed decisions about optimization and cleanup.
July is Database Health Monitor Month!
July has arrived, and it’s time to turn our attention to the heartbeat of our digital world – our databases! As the founder of Database Health and Stedman Solutions, I’m thrilled to proclaim this month as Database Health Monitor Month! This is our annual chance to celebrate the unsung heroes safeguarding our precious data and to explore the intricate web of data structures and relationships within our systems. Let’s take a closer look at their health, uncover hidden issues, boost performance, and ensure our data highways are running seamlessly. This July, let’s commit to not just keeping our databases operational, but ensuring they thrive at peak performance!
This month also marks the anniversary of Database Health Monitor. To celebrate, I’m excited to offer 25% off the licensing fee for the annual subscription to Database Health Monitor. Don’t miss this opportunity to enhance your database management!
Mastering Database Insights with the Table Use Report in Database Health Monitor
In the fast-paced world of data management, databases serve as the cornerstone of organizational success, quietly powering applications, storing critical information, and enabling seamless operations. However, not all tables in a database are created equal—some are bustling hubs of activity, while others may lie dormant, consuming valuable resources without contributing to your workflows. Understanding how your tables are used is key to optimizing performance, reducing costs, and maintaining a secure environment. That’s where the Table Use Report in Database Health Monitor comes in—a powerful tool designed to provide deep insights into SQL Server table usage. In this comprehensive blog post, we’ll explore the report’s features, dive into its practical applications, and explain how it can transform the way you manage your databases.
What is the Table Use Report?
The Table Use Report is a feature of Database Health Monitor that tracks and displays the last accessed time for each table in your SQL Server database. By capturing when tables were last queried, it offers a clear picture of which tables are actively supporting your applications and which may be outdated or underutilized. This information is invaluable for database administrators (DBAs) looking to streamline operations, enhance performance, or conduct audits. Whether you’re managing a sprawling enterprise database or a compact system, the Table Use Report empowers you to make informed decisions that keep your database running at its best.
Unlike generic monitoring tools, the Table Use Report is tailored to provide actionable insights specific to SQL Server environments. It combines visual and tabular data to present a holistic view of table activity, making it accessible to both seasoned DBAs and those new to database management. With this report, you can move beyond guesswork and base your optimization strategies on hard data.
Anatomy of the Table Use Report
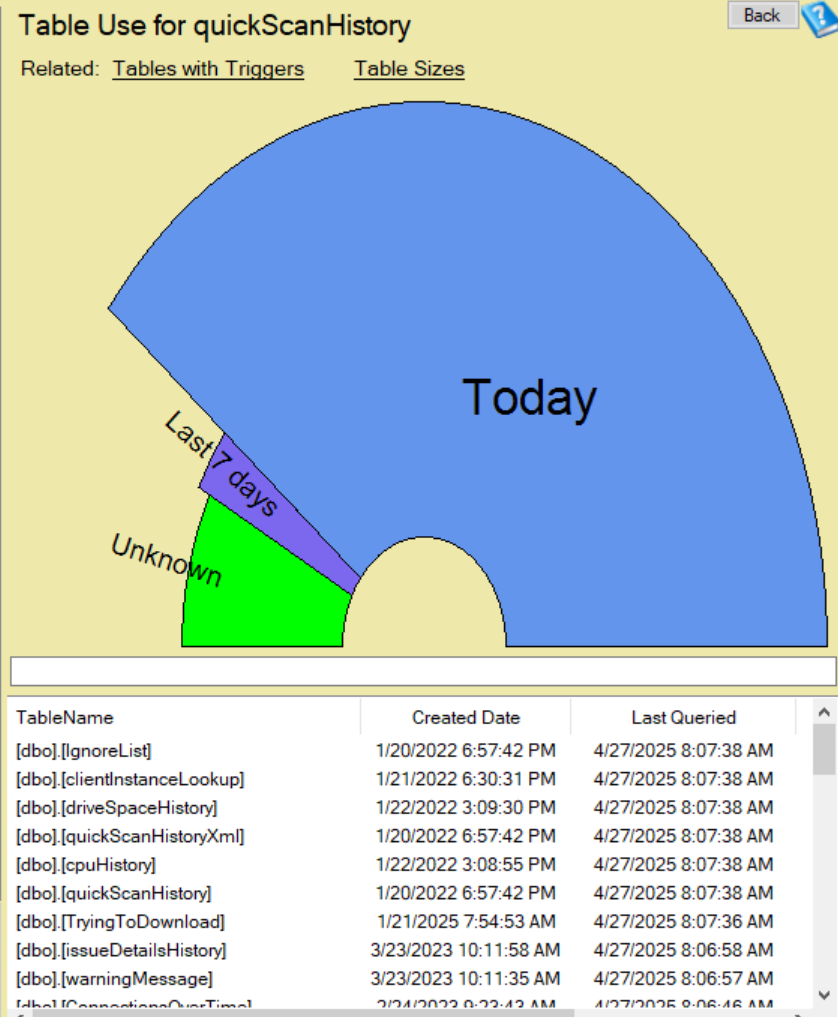
The Table Use Report is thoughtfully designed to present information in two complementary formats, ensuring you can quickly grasp the big picture while also diving into granular details when needed.
Graphical Representation
The report kicks off with a fan chart that visually categorizes tables based on their last usage. This intuitive graphic breaks down table activity into three distinct groups:
- Today (Blue): Tables that have been queried today, indicating high activity and critical importance to current operations.
- Last 7 Days (Purple): Tables accessed within the past week, showing recent but less immediate usage.
- Unknown (Green): Tables with no recorded query activity, which may suggest they are unused or obsolete.
This visual representation allows you to instantly assess the distribution of table activity across your database, helping you identify trends and prioritize your efforts.
Detailed Table View
For those who need specifics, the report includes a detailed grid that lists key information for each table. The columns in this view include:
- Table Name: The name of the database table, making it easy to identify.
- Created Date: The date the table was created, providing context on its age and relevance.
- Last Queried: The most recent time the table was accessed, offering a precise timestamp for activity.
- Range Used: The category of usage (e.g., “Today”, “Last 7 Days”, “Unknown”), summarizing how recently the table was queried.
This tabular view is perfect for in-depth analysis, allowing you to sort, filter, and drill down into individual tables to understand their role in your database ecosystem.
Practical Applications of the Table Use Report
The Table Use Report is more than just a snapshot of table activity—it’s a versatile tool with a wide range of applications that can significantly impact your database management strategy. Here are some key use cases:
- Performance Tuning: Frequently accessed tables are prime candidates for optimization techniques like indexing, partitioning, or caching. By identifying these high-traffic tables, you can focus your efforts where they’ll have the greatest impact on query performance.
- Database Cleanup: Unused or rarely accessed tables can clutter your database, consuming storage and complicating maintenance. The report helps you pinpoint tables that may be candidates for archiving or deletion, freeing up valuable resources.
- Security Auditing: Monitoring table usage is critical for security. The report allows you to verify that sensitive or critical tables are being used as expected and to detect any anomalies, such as unexpected access to dormant tables.
- Storage Optimization: Large, rarely accessed tables can be compressed or moved to lower-cost storage tiers. The Table Use Report helps you identify these opportunities to reduce database size and lower operational costs.
- Capacity Planning: Understanding table usage trends can inform future infrastructure decisions, such as scaling storage or upgrading hardware to accommodate growing workloads.
By addressing these areas, the Table Use Report helps you maintain a lean, efficient, and secure database environment that supports your organization’s goals.
Interpreting the Report: What the Data Tells You
To make the most of the Table Use Report, it’s important to understand what each category means and how to act on the information:
- Today: Tables in this category are actively queried and likely central to your current operations. These are your high-priority tables for Performance Tuning and monitoring.
- Yesterday: Tables accessed yesterday but not today may still be relevant but less critical. Monitor these for changes in usage patterns.
- Last 7 Days: Tables used within the past week (but before yesterday) indicate recent activity. These may include tables tied to periodic processes or reporting tasks.
- Unknown: Tables with no recorded activity since the last SQL Server restart may be obsolete, unused, or part of a legacy system. These require further investigation to determine whether they can be safely archived or removed.
It’s worth noting that SQL Server only tracks table usage since the last server restart. If your server was recently rebooted, you may see more tables in the “Unknown” category. To get a more accurate picture, allow the server to run for a few days or weeks before relying heavily on this category for cleanup decisions.
Why the Table Use Report Matters
In today’s data-driven world, databases are under constant pressure to perform reliably and efficiently. The Table Use Report in Database Health Monitor provides a window into your database’s inner workings, revealing which tables are driving value and which may be holding you back. By leveraging this report, you can:
- Optimize resources by focusing on high-impact tables.
- Reduce costs by eliminating unnecessary storage and maintenance overhead.
- Enhance security by ensuring tables are used appropriately.
- Improve overall database health, leading to faster queries and happier users.
Whether you’re managing a single database or a complex multi-server environment, the Table Use Report simplifies the task of keeping your SQL Server in top condition.
Getting Started with Database Health Monitor
The Table Use Report is just one of many powerful features in Database Health Monitor, a comprehensive tool designed to help DBAs monitor, diagnose, and optimize SQL Server databases. With its user-friendly interface, robust reporting, and deep insights, Database Health Monitor is an essential companion for anyone responsible for database management.
Ready to take control of your database’s performance? Download Database Health Monitor today and explore the Table Use Report for yourself. See firsthand how it can help you uncover hidden opportunities, streamline operations, and ensure your databases are running at peak efficiency. Don’t let unused tables or performance bottlenecks slow you down—empower your database management with Database Health Monitor.
Check out this offer:Explore our Database Health Monitor special pricing.
Here are all the discounts for Database Health Monitor. Pick the one that fits your server count.
25% off 1 Instance – Code: 25OFF1
25% off 10 Instances – Code: JULY25
25% off 20 Instances – Code: 25OFF20 – Best Value
Free Backup and Restore Course when You Purchase Database Health Monitor
Purchase a new one-year Database Health Monitor subscription during the fourth week of July and receive our SQL Server Backup and Restore Course free of charge. Backups are your last line of defense when disaster strikes, but many organizations don’t discover problems until they need to perform a restore. This course walks through backup strategies, recovery models, restore techniques, and best practices to help ensure your data is protected and recoverable when it matters most. Pairing strong backup practices with the monitoring capabilities of Database Health Monitor gives you greater confidence in the health and resilience of your SQL Server environment. A $39.99 value included free with your purchase.
Check out this offer:Explore our Database Health Monitor special pricing.
Here are all the discounts for Database Health Monitor. Pick the one that fits your server count.
25% off 1 Instance – Code: 25OFF1
25% off 10 Instances – Code: JULY25
25% off 20 Instances – Code: 25OFF20 – Best Value
Free Backup and Restore Course when You Purchase Database Health Monitor
Purchase a new one-year Database Health Monitor subscription during the fourth week of July and receive our SQL Server Backup and Restore Course free of charge. Backups are your last line of defense when disaster strikes, but many organizations don’t discover problems until they need to perform a restore. This course walks through backup strategies, recovery models, restore techniques, and best practices to help ensure your data is protected and recoverable when it matters most. Pairing strong backup practices with the monitoring capabilities of Database Health Monitor gives you greater confidence in the health and resilience of your SQL Server environment. A $39.99 value included free with your purchase.