Performance History
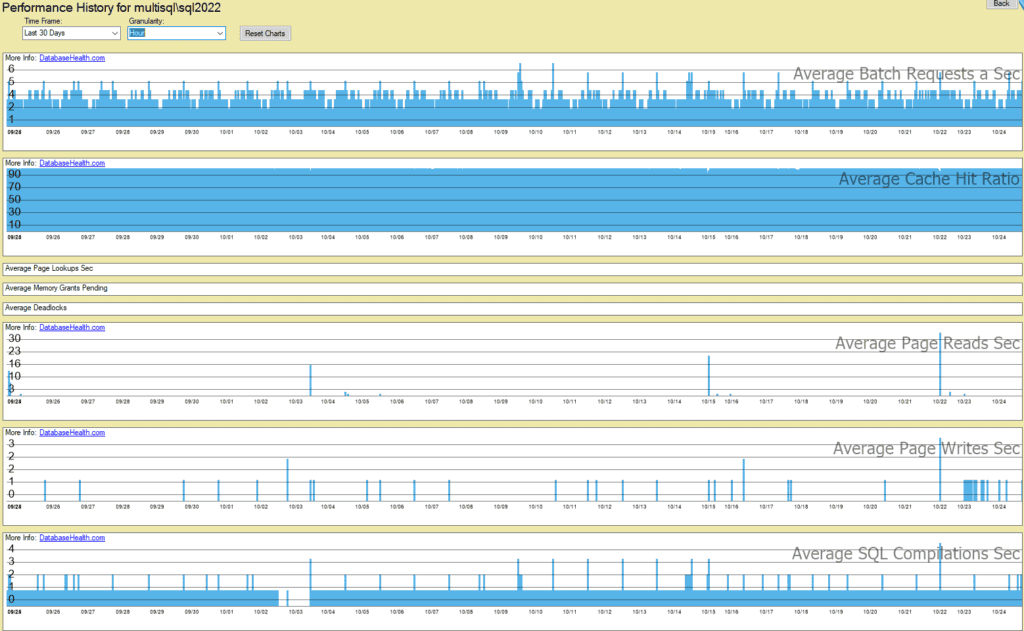
The SQL Server Performance History Instance Report is a comprehensive tool designed to provide insights into the performance and health of your SQL Server instance. It offers detailed analysis of various key performance metrics, helping to identify potential issues and optimize your SQL Server environment.
The Performance History report features a variety of charts that monitor essential metrics such as:
- Batch Requests per Second
- Cache Hit Ratio
- Memory Grants Pending
- Deadlocks
- Page Life Expectancy
- Page Lookups per Second
- Page Reads per Second
- Page Writes per Second
- SQL Compilations per Second
- SQL Recompilations per Second
- Target Server Memory (MB)
- Total Server Memory (MB)
- Transactions per Second
These metrics help assess the health and efficiency of your SQL Server environment, enabling you to make informed decisions regarding resource allocation and performance tuning.
Charts can also be moved and collapsed by right clicking at the top of them, these changes are persistent between sessions.

Getting Help from the Stedman Solutions Team
We are ready to help. The team at Stedman Solutions is here to help with your SQL Server needs. Get help today by contacting Stedman Solutions through the free 30 minute consultation form.