What is your baseline?
Establishing a performance baseline is important with SQL Server. Think of it this way if you car normally runs well on the highway, but suddenly you can’t get it up to highway speeds you know that something is wrong. You enter the highway at half the speed as other cars, people are honking at you and waving with various hand gestures. It is pretty obvious that you are not up to speed.
With your SQL Server it is not always that obvious. You might have a 30% slowdown in queries and few people pay complain.
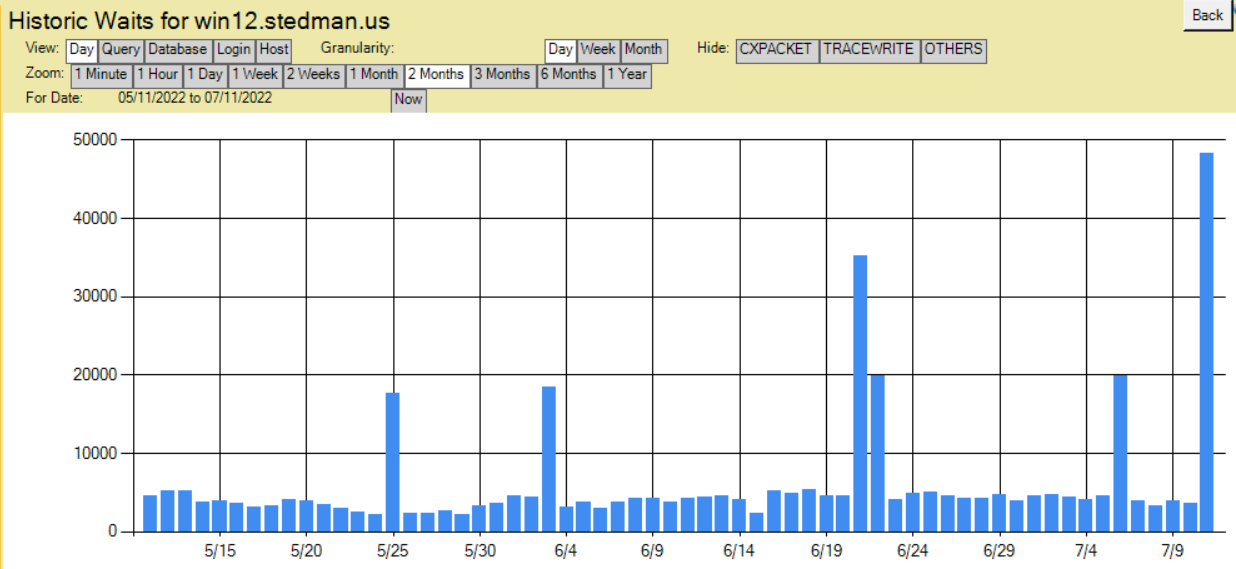
I like to use a number of factors for a SQL Server baseline. Not just can we get up to highway speeds, but what is actually slowing things down. The first thing I look at is Wait Statistics, how how much time is SQL Server waiting. Here is an example chart that I use from Database Health Monitor.
From this chart, I can see over several months that the baseline is fairly level, and on 6 days in the chart below there was something out of the ordinary.
On this specific test server I know that most of those specific waits were around testing blocking, but If I didn’t know that this would be something that I need to investigate.
Here is another example. The right bar spiking was associated with a code deploy that had some really slow queries associated with it.
With this chart I was able to quickly determine that something significantly changed, and it allowed me to track down what queries were causing the problems, and work with developers to get it fixed. Without that baseline I would not have been able to quickly determine the issue, or to even know that something had slowed down.
What do you use for your baseline monitoring? Do you know what your baseline is and are you aware when it changes?
