SQL Server TempDB Allocation: What’s Actually Filling It
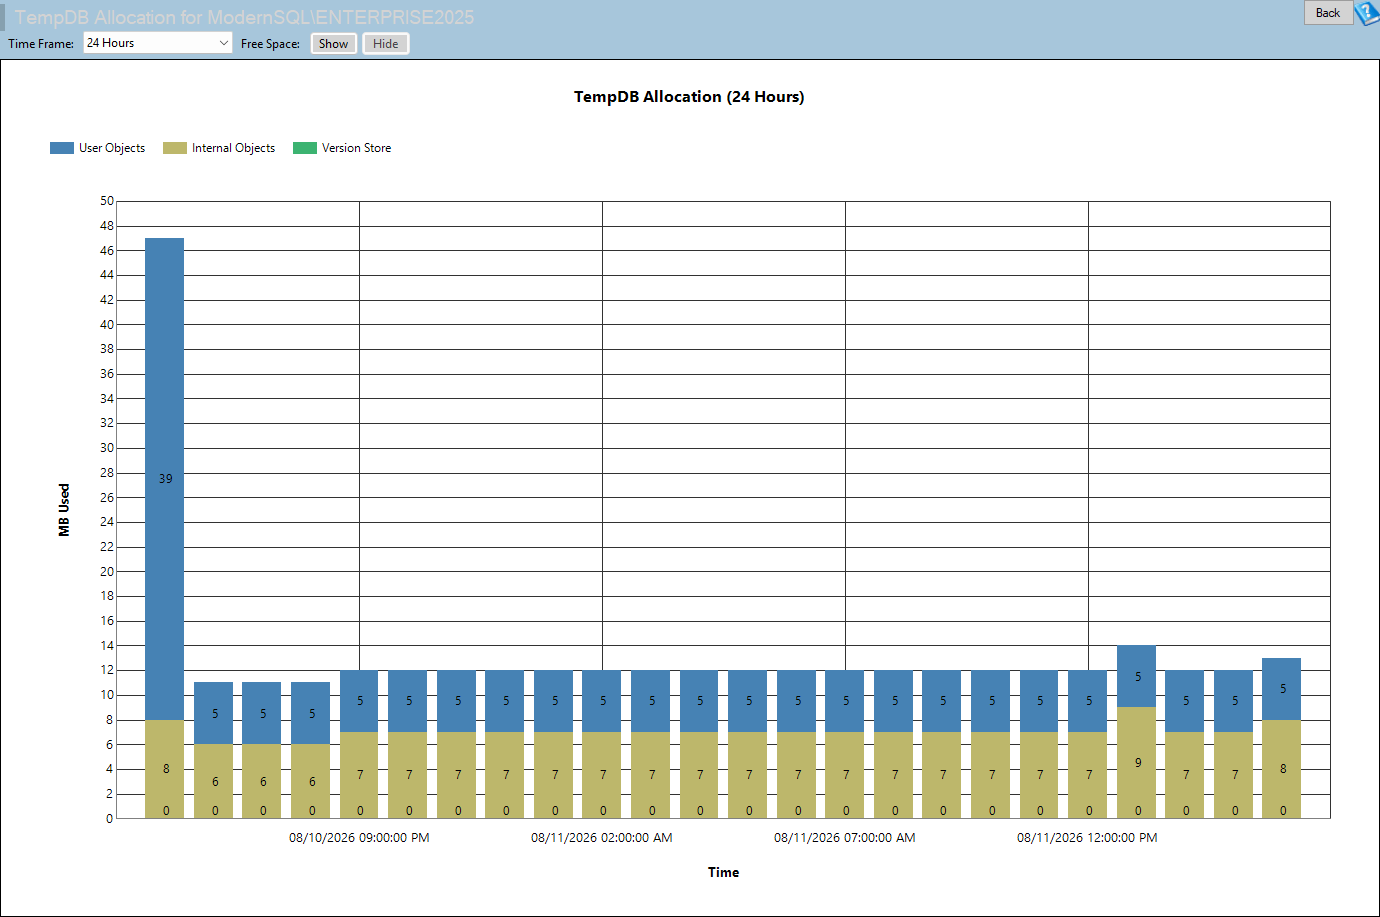
A drive that was sized with plenty of headroom now fills by mid-afternoon three days out of five, always the same three. Somebody adds a data file to tempdb, or schedules a restart for the weekend because a freshly recreated tempdb starts out empty, and either move buys a few quiet days before the same alert fires again. Neither one answers what was actually consuming the space, and until that question has an answer, every fix applied to it is a guess wearing a decision's clothes. Watching SQL Server tempdb allocation creep upward through a shift without knowing which of several unrelated causes is behind it is exactly how a one-time incident turns into a recurring one.
The instinct to make tempdb bigger or to bounce the instance treats the symptom, not the cause. A restart genuinely clears the problem for a while, because tempdb rebuilds from nothing at startup, but that only resets the clock; it does not explain why the same three days repeat. Growing the files without knowing what filled them the first time usually means writing a check that gets cashed again within a quarter, just with a bigger number attached to it.
Tempdb usage is not one thing worth watching, it is three, and they rarely share an owner. Temporary tables and table variables your own code created belong to whoever wrote the procedure. Sort and hash work areas the query engine builds for itself while a plan executes usually trace back to a memory grant that was sized too small. Row versions kept alive for snapshot isolation, read committed snapshot or an online index operation belong to whichever session has had a transaction open the longest. Add all three together and the only thing you can say is 'tempdb is full.' Keep them apart and you know who to call.
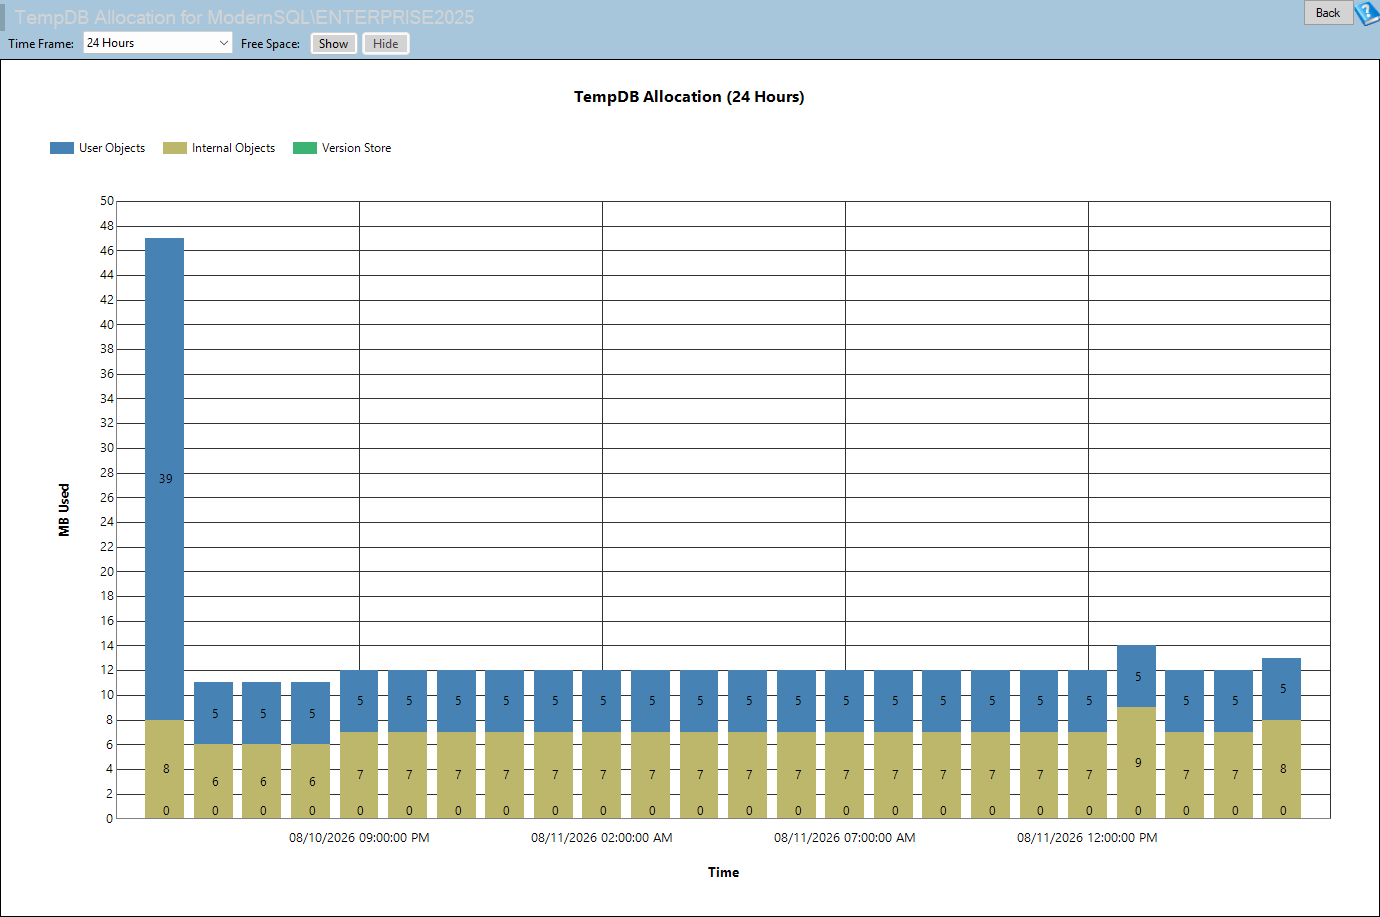
TempDB Allocation is one of the reports in Database Health Monitor. It runs against your own servers, and it takes about a minute to have this same screen open on one of them.
Splitting SQL Server tempdb allocation into three bands
This report lives under a database, specifically under tempdb itself. Expand tempdb, then Historic, and the three tempdb-specific history nodes are there because they only mean anything in that one database. The page title names the server, so there is no ambiguity about which instance produced the chart. Reading it needs two things in place beforehand: a historic database configured to hold what gets recorded, and the collection job actually running, because a stretch with no collection is drawn as zero rather than left blank, which matters a lot once you get to the part about reading zeros.
| Band | What built it | Who fixes it |
|---|---|---|
| 'User Objects' | Temporary tables and table variables created by application or procedure code. | Whoever owns the code. |
| 'Internal Objects' | Sorts, hashes, spools and work tables the engine builds for a query plan. | Whoever tunes the query, almost always a memory grant. |
| 'Version Store' | Row versions kept for snapshot isolation, read committed snapshot, triggers or online index work. | Whoever left a transaction open. |
Why the average can hide the spike
The Time Frame control opens on 24 Hours and also offers 48 Hours, 7 Days and 30 Days, and the bar width changes underneath it so the chart stays legible: hourly bars at 24 and 48 hours, four-hour bars across a week, daily bars across a month. Every bar is an average across its bucket, not a peak, and that matters the moment you are chasing something specific. A version store that spiked hard for twenty minutes inside a four-hour bucket gets averaged down to a fraction of how tall it actually got. Pull the time frame in tighter before trusting a spike's height, and reach for TempDB High Usage when you need the individual sessions behind it rather than an average of them.
There is a fourth band available, for the unused space still sitting in the tempdb files, and it is switched off to start. Turn it on and it is usually the tallest thing on the page by a wide margin, which flattens the three bands you actually came to compare. It earns its place when the question changes from what is using tempdb to how close this came to filling every file, because with it showing, the total height of the stack is the size of tempdb itself and the fourth band is the headroom left.
What each shape on the chart is telling you
- Version store rising all day and dropping overnight usually means a long reporting query running under snapshot isolation. It falls when that query finally finishes, and the fix is the query, not tempdb.
- Internal objects spiking on a schedule points at a job or report whose plan spills, and the spill is almost always downstream of a bad cardinality estimate.
- User objects sitting as a flat plateau instead of moving usually means a session held open by an application that never lets go of its connection.
- All three bands staying low with free space filling most of the picture just means tempdb has more room than it needs, worth knowing before another file gets added.
- Every band at zero for a stretch of bars means the collection job stopped, not that tempdb went quiet. A genuinely quiet period still shows a little internal object activity.
- A step change in all three bands at the same moment is a restart. Tempdb rebuilds from nothing every time the instance starts, so the history begins over.
Turning the band into a next step
Find the tallest band and follow its shape across the window; that is most of the read. If it is internal objects, Memory Grants and Spills names the queries responsible, and Parallelism Calibration often explains why the grant was wrong to begin with. If it is version store, Open Transactions and Active Queries will show which session has been running long enough to be holding everything else back, because cleanup only happens behind the oldest transaction still active anywhere on the instance. If it is user objects, TempDB High Usage attributes the space to a session and a statement instead of leaving it as a band on a chart. Check the shape against the clock either way: a peak every night is a job, a peak every weekday morning is people arriving at their desks.
None of this shows up in a single 'tempdb is full' alert, and it never will, because that alert was never measuring the right thing. The three bands are what was actually consuming the space, sorted by owner, which is the only version of that question worth answering twice.
Try Database Health Monitor Today
It replaces a single 'tempdb is full' alert with three separate bands so you know in seconds whether the cause is your code, a spilling query plan, or a transaction nobody closed. Database Health Monitor shows it on every instance you connect, in the time it takes to open the report.
Download Database Health Monitor and run the TempDB Allocation report against your own server. There is nothing to configure first, and you will know inside a few minutes whether it tells you something you did not already know.
Related reading: Who Changed the Schema? Find Out in SQL Server. A companion piece walks through the DDL trigger that captures every ALTER, CREATE and DROP with the login, host and application behind it, useful for anyone who has ever needed to know who changed the schema and had no way to find out.