Understanding the Job History Report in Database Health Monitor
July is Database Health Monitor Month!
July has arrived, and it’s time to turn our attention to the heartbeat of our digital world – our databases! As the founder of Database Health and Stedman Solutions, I’m thrilled to proclaim this month as Database Health Monitor Month! This is our annual chance to celebrate the unsung heroes safeguarding our precious data and to explore the intricate web of data structures and relationships within our systems. Let’s take a closer look at their health, uncover hidden issues, boost performance, and ensure our data highways are running seamlessly. This July, let’s commit to not just keeping our databases operational, but ensuring they thrive at peak performance!
This month also marks the anniversary of Database Health Monitor. To celebrate, I’m excited to offer 25% off the licensing fee for the annual subscription to Database Health Monitor. Don’t miss this opportunity to enhance your database management!
The Job History Report in Database Health Monitor delivers timeline-based tracking of SQL Server Agent jobs to quickly surface failures and performance bottlenecks. This supports reliable automation for backups, index maintenance, integrity checks, ETL processes, and reporting jobs.
Instead of manually reviewing SQL Server Agent history, Database Health Monitor surfaces job execution details through an interactive timeline and list view for faster troubleshooting.
Visualizing SQL Server Agent Activity
The Job History Report gives you a 24-hour timeline view of SQL Server Agent job executions. This makes it easy to see when jobs ran throughout the day and how they overlap with one another.
Here is a short video showing the Job History Report in Database Health Monitor.Each job execution appears in its scheduled time slot, providing a quick visual representation of:
- When jobs started
- How long they ran
- Whether they succeeded or failed
- How frequently they executed
- Potential scheduling conflicts or overlaps
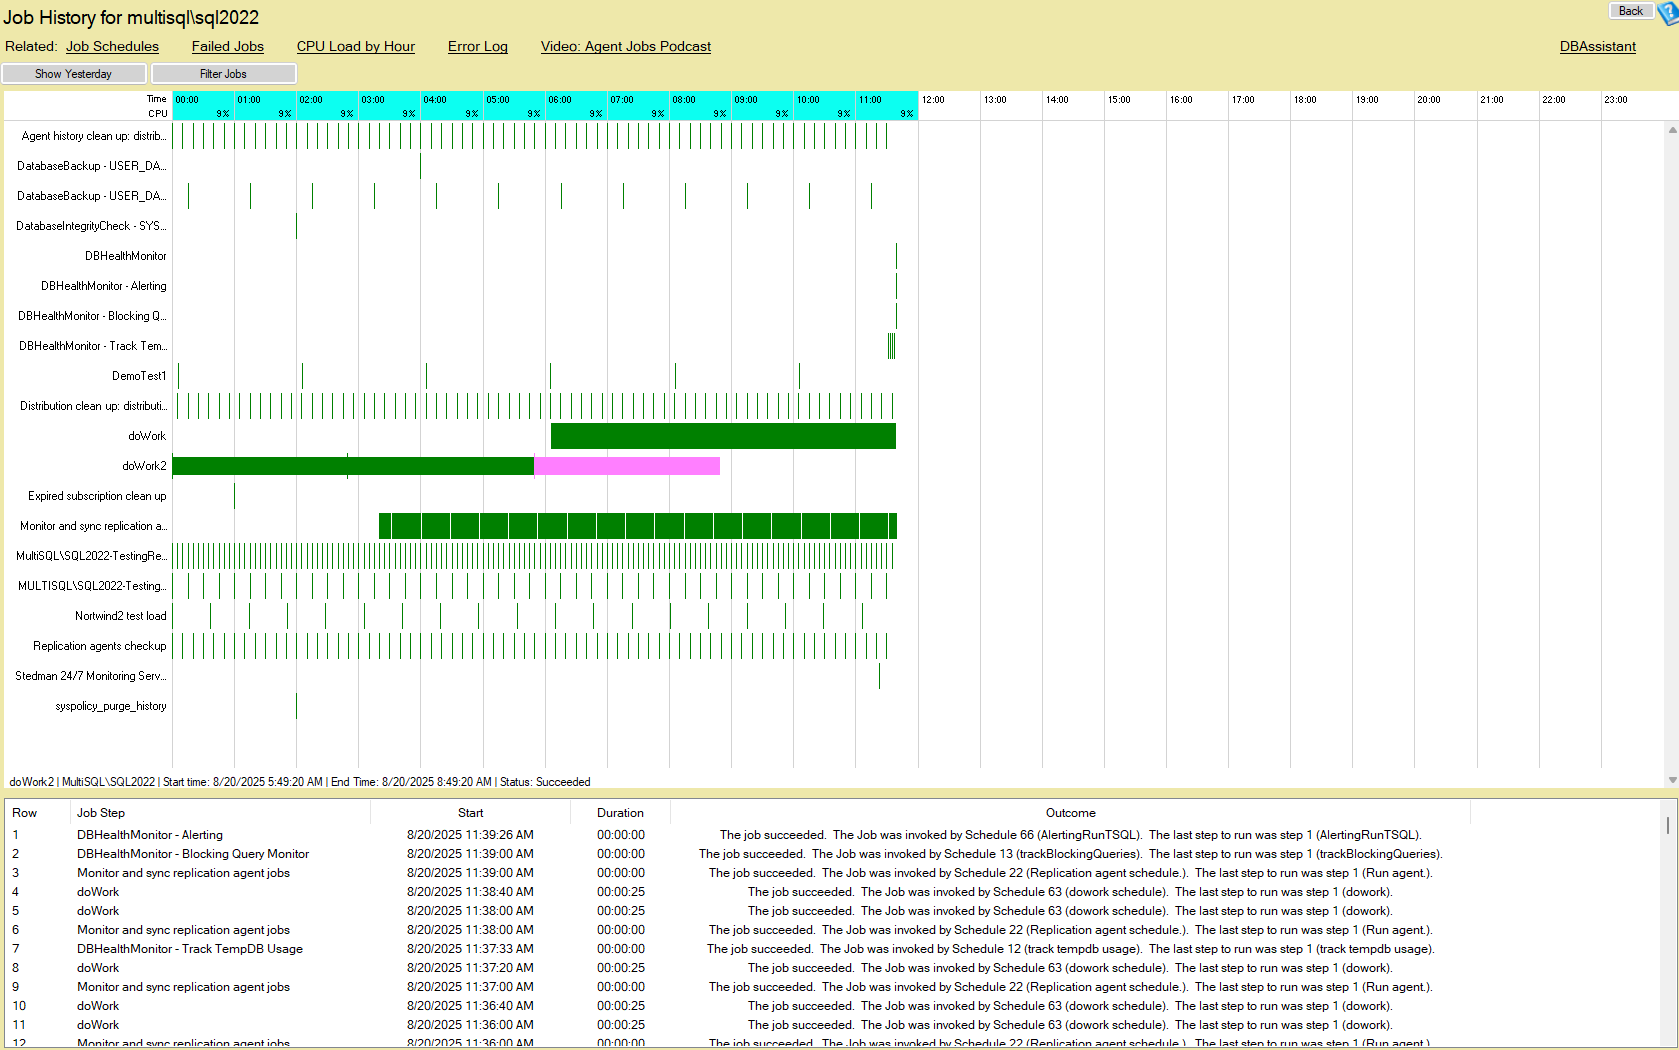
By hovering over a job execution on the timeline, you can immediately see additional details including:
- Job name
- Start time
- End time
- Execution outcome
This visual approach makes it much faster to identify problems compared to manually reviewing job history tables or navigating through SQL Server Management Studio.
Filter the Noise and Focus on What Matters
In busy SQL Server environments, there may be dozens or even hundreds of SQL Server Agent jobs running throughout the day. The filtering options in the Job History Report allow you to narrow the display to only the jobs you care about.
This makes it easier to:
- Focus on failed jobs
- Review maintenance jobs
- Analyze ETL activity
- Investigate long-running processes
- Monitor critical production workloads
Detailed Job Step Information
Below the timeline, the report includes a detailed list view containing execution data for each job step.
The detailed view includes:
- Job Step – The specific step within the SQL Server Agent job
- Start Time – When the job step began execution
- Duration – How long the step took to complete
- Outcome – Whether the step succeeded, failed, retried, or was canceled
This combination of timeline visualization and detailed execution data gives DBAs both a high-level operational overview and the low-level information needed for troubleshooting.
Common Uses for the Job History Report
Monitor Scheduled Jobs
Quickly confirm that backups, maintenance plans, ETL jobs, and other scheduled tasks are running successfully throughout the day.
Identify Failed Jobs
Spot failures immediately using the visual timeline and detailed list view. This helps reduce the time needed to detect and respond to issues.
Analyze Long-Running Jobs
Look for jobs that are taking longer than expected or overlapping with other important workloads. This can help identify opportunities for tuning or rescheduling.
Troubleshoot SQL Server Agent Problems
Drill into specific job steps to determine exactly where failures occurred and gather the information needed to resolve issues quickly.
Why Visual Job Monitoring Matters
SQL Server environments often depend heavily on automation. When jobs fail silently or begin taking longer than expected, it can lead to missed backups, delayed reporting, blocking, performance problems, or failed business processes.
The Job History Report in Database Health Monitor helps you detect these issues quickly by turning raw SQL Server Agent history into an organized and visual monitoring experience.
Try Database Health Monitor
If you are managing SQL Server environments and want better visibility into SQL Server Agent job activity, Database Health Monitor makes it easier to monitor, troubleshoot, and understand what is happening on your servers.
Download Database Health Monitor today and explore the Job History Report along with many other SQL Server monitoring and troubleshooting features.
Check out this offer:Explore our Database Health Monitor special pricing.

Here are all the discounts for Database Health Monitor. Pick the one that fits your server count.
25% off 1 Instance – Code: 25OFF1
25% off 10 Instances – Code: JULY25
25% off 20 Instances – Code: 25OFF20 – Best Value
Free SQL Server Performance Tuning Course
During the second week of July, every new one-year Database Health Monitor subscription includes our SQL Server Performance Tuning Course at no extra charge. Learn proven techniques for identifying bottlenecks, analyzing waits, improving query performance, and resolving common SQL Server performance issues. Combined with the monitoring and diagnostic capabilities of Database Health Monitor, this course helps you move from simply identifying problems to solving them effectively. A $299.99 value included free with your purchase.