Finding the Heaviest TempDB Statements Over Weeks
Tempdb hit 90 percent full again overnight, and by the time you logged in it was back to normal. Somebody has to say which of the heaviest tempdb statements did it, and the live views cannot, because they only show who is heavy right now.
How do I find the heaviest tempdb statements in SQL Server? The heaviest tempdb statements are found by adding up sampled tempdb use per statement over weeks, not by looking at one moment. Rank statements by peak, GB-minutes and share of heavy use, check which are growing, and match version store spikes to long requests open at the time.
Why one snapshot misleads you
The usual first move is to open a live view and sort by tempdb pages. That works if you happen to look during the spike. The nightly job ran at 2 a.m. You looked at 9.
A single heavy sample has a second flaw. One loud statement on one night is not the same as the statement that is quietly heavy every day. Size tempdb for the loud one and you waste disk. Ignore the habitual one and the problem stays.
What you want is the sum. How much tempdb did each statement use, how often, and is it getting worse? If you want the composition of tempdb over time first, SQL Server TempDB Allocation: What's Actually Filling It covers that side.
Ranking the heaviest tempdb statements
Database Health Monitor answers this with the TempDB Consumer Trends report. It adds up data already sitting in DBHealthHistory, so nothing new is collected. Find it under tempdb in the server tree, then Historic.
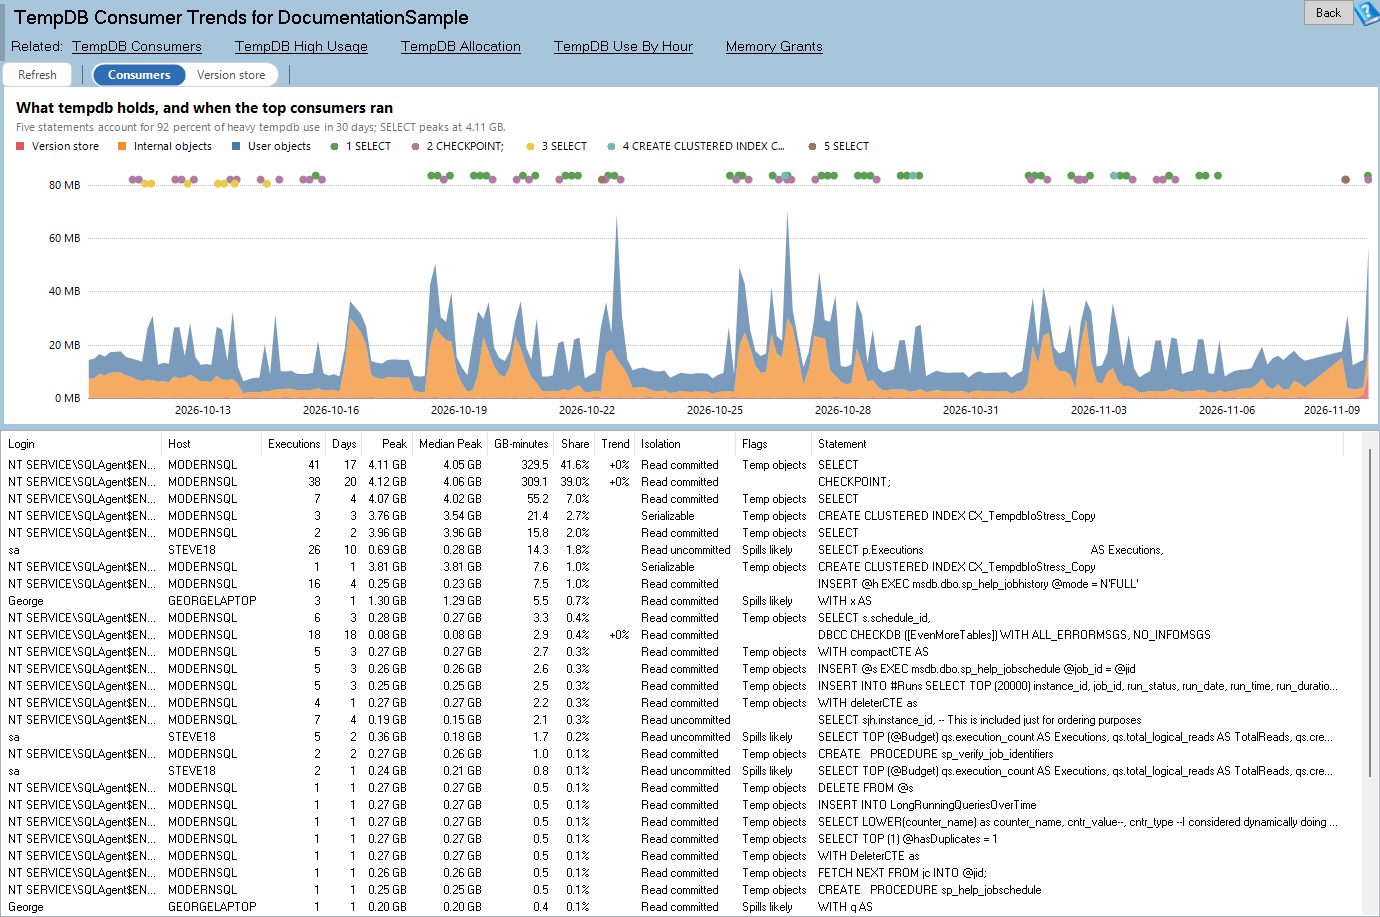
TempDB Consumer Trends is one of the reports in Database Health Monitor. It runs against your own servers, and it takes about a minute to have this same screen open on one of them.
The headline reads like a verdict, for example five statements accounting for 78 percent of heavy tempdb use in 30 days. Below it, the chart stacks version store, internal objects and user objects. Hover a dot to see the statement, the time, the peak and the login.
The Consumers view is the ranking. Each row carries executions, days seen, peak, median peak per execution and share of the heavy use. The honest column is GB-minutes: the allocated GB at each sample times the 2 minutes it represents, summed. A statement that peaks at 40 GB for four minutes and one that sits at 8 GB for an hour are very different tempdb problems, and a bare peak cannot tell them apart.

Trend compares the median peak of the last 7 days with the 21 days before it. A rise of 25 percent or more earns Growing. Daily means the statement shows up on 80 percent of the days in the history. Spills likely and Temp objects mean internal or user objects made up more than 60 percent of used tempdb when it was sampled.
| Flag | What it points at |
|---|---|
| Spills likely | Sorts, hashes or spools; check the memory grant and the plan |
| Temp objects | Temp tables; index them and size them to their rows |
| Snapshot | Version store use; look at transaction length |
When the version store is the culprit
The Version store view lists every period the store ran above twice its median for the previous 7 days and above 1 GB. Each episode shows the start, the duration, the peak and the usual size. It also names the long requests that were already open when it began, oldest first.
That last part is the point. A version store only grows when something old holds it open. Seeing a 9 hour request from one login beside a 60 GB peak tells you what to shorten.
Know the limits. Only sessions above 50 MB are recorded, every 2 minutes, so a swarm of small consumers can hide and a very short run can slip between samples. The notes state how much used tempdb no recorded session explains. Open transactions with no request are not listed as holders.
Heavy sessions come from tempDBUsage, which keeps 45 days by default. Composition and version store come from tempDBAllocation at 30 days. Holders come from LongRunningQueriesOverTime. For the full reference, see TempDB Consumer Trends.
What to check on your own server
- Check the Consumers view for statements flagged Growing, then compare their median peak against the last 7 days
- Review any statement flagged Spills likely and inspect its memory grant and plan
- Index and right-size the temp tables behind any statement flagged Temp objects
- Open the Version store view and find the long requests that were running when each episode began
- Shorten those transactions, or confirm that snapshot isolation is really needed
Try Database Health Monitor Today
It ranks the statements that habitually use the most tempdb over weeks, so you size tempdb and aim tuning at the right code instead of guessing. Database Health Monitor shows it on every instance you connect, in the time it takes to open the report.
Download Database Health Monitor and run the TempDB Consumer Trends report against your own server. There is nothing to configure first, and you will know inside a few minutes whether it tells you something you did not already know.