SQL Server Plan Cache: Which Database Is Eating Memory?
Memory on the server looks tight, a query that was fast yesterday is reading from disk today, and nobody can say where the memory went. Data pages get the blame every time. But the SQL Server plan cache is memory too, and on a busy ad hoc workload it can quietly take a startling amount.
How do I find which database is using the most memory in the SQL Server plan cache? To see where your SQL Server plan cache memory is going, split it by user database and compare memory held against the number of cached queries. Large memory with few queries means big plans, which is normal. Large memory with tens of thousands of entries means ad hoc SQL that will never be reused.
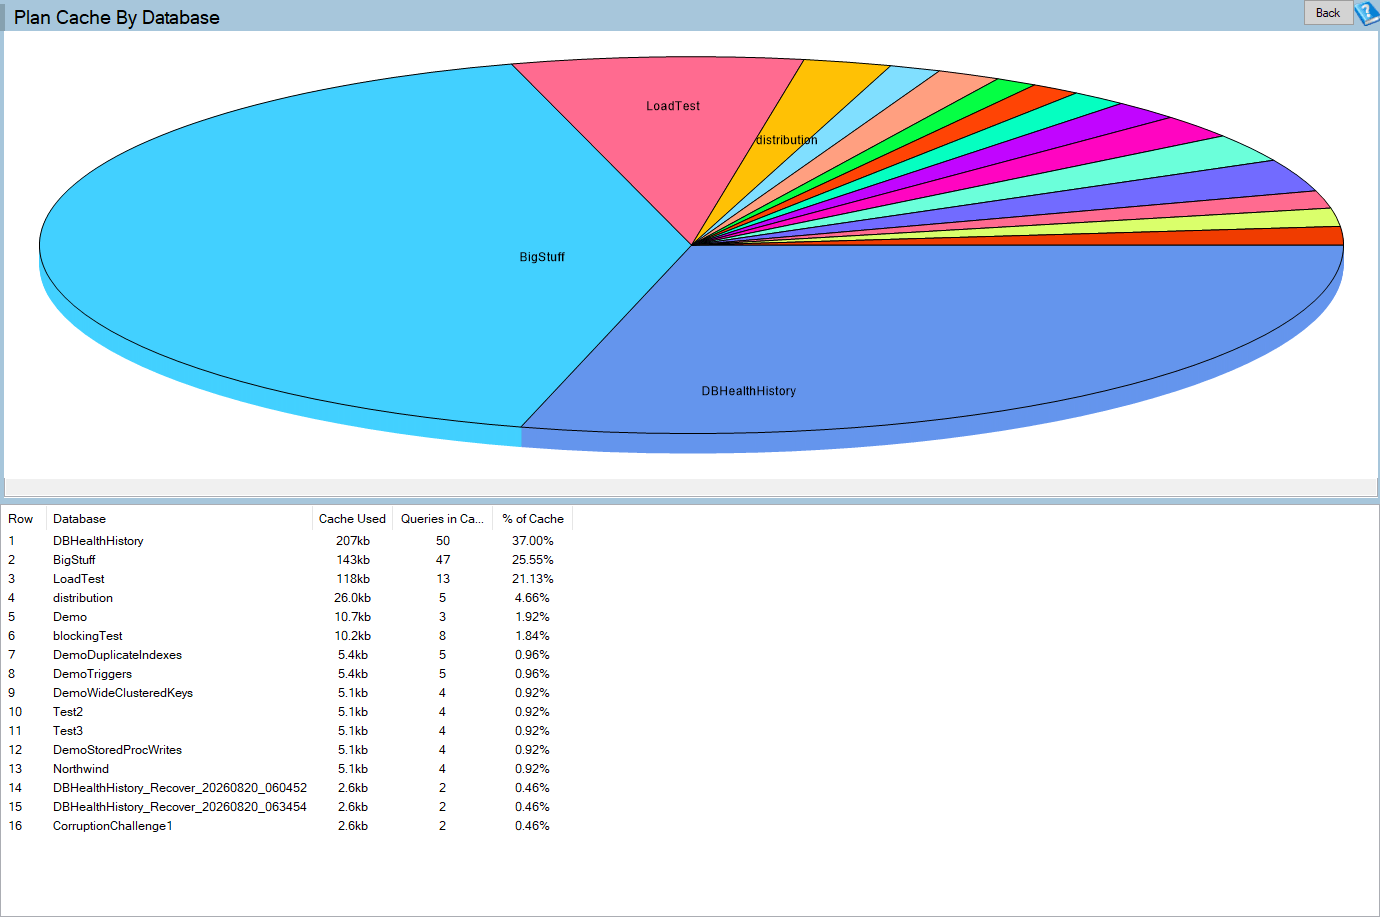
Database Health Monitor has an instance level report that answers the first question, which is whose plans are holding that memory. It is called Plan Cache By Database, and it takes one click to open.
Plan Cache By Database is one of the reports in Database Health Monitor. It runs against your own servers, and it takes about a minute to have this same screen open on one of them.
The number everyone checks first
Most of us start with a total. How big is the cache, how many plans are in it. A single instance wide figure feels like an answer, and it is not one. It cannot tell you which database is responsible, and without that you have nothing to act on.
The plan count misleads in a second way. A database with a few thousand small plans and a database with a few dozen enormous ones can hold the same memory. Counting plans ranks them as wildly different. Memory is the part that matters, so memory is what you should rank by.
Measure memory held, per user database
The report sizes each slice by the memory that database's cached plans hold. Not the number of plans. The pie sits above a five column grid, largest database first, and every slice and every row opens the Plan Cache report for that database.
Only databases with a database id above 4 are counted. That leaves out master, model, msdb and tempdb, so system databases never dilute the percentages or crowd the top of the list. The percentages are therefore a share of the user database cache, not of every cached plan on the instance. If they do not match a query you wrote against the cache yourself, that is usually why.
Nothing is installed on the monitored instance and nothing is stored. You need a connection and permission to read the plan cache. What you see is a snapshot of memory right now.
Reading the SQL Server plan cache by database
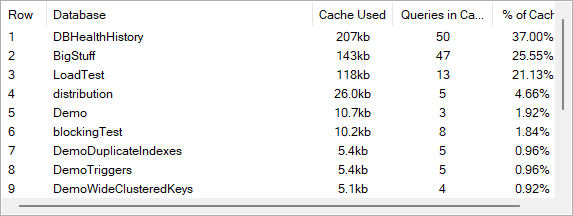
The columns are Row, Database, Cache Used, Queries in Cache and % of Cache, the last to two decimal places. The ratio between the middle two tells you what kind of memory you are looking at.
| What you see | What it usually means |
|---|---|
| Large Cache Used, few queries | A small number of big plans. Complex queries or large stored procedures. Normal. |
| Large Cache Used, very many queries | Ad hoc SQL. Statements that differ only by a literal each get their own plan and memory, and none will be reused. |
The second row is the one to chase. Tens of thousands of cached entries for one database is ad hoc SQL, whatever else it is. A reporting database with an enormous plan count usually has a tool building statement text instead of parameterizing it.
A big cache is not bad by itself. A big cache full of plans that get reused is the cache doing its job. A big cache full of single use plans is memory spent on nothing.
What to do with the answer
Work down the page in order. Start with the biggest slice and ask whether it is the database you would expect to be busiest. On a single application instance, one database taking almost the whole pie is normal. Check its query count before deciding anything.
Then compare it against the database's size and activity. A small, quiet database holding a large share of the cache is doing something odd, and that is the slice worth opening. Click through to Plan Cache for it and you see the individual plans, how often each has been used, and how much each holds.
To measure how much of that memory is wasted, go next to One Time Use Queries by Database. It shows what was compiled once and never reused. Queries Needing Params by Database then names the statements causing it. Together they turn a vague memory complaint into a list of statements to fix.
If the offending SQL comes from an application, you still need to know who is sending it. The post Who Is Connected to SQL Server, and What They're Doing covers finding the sessions behind a workload.
When the pie looks wrong
A small pie means the cache was recently emptied. A restart, DBCC FREEPROCCACHE, a configuration change or memory pressure will all do it. The figures reset when the service restarts, so a number that looks alarming straight after one usually is not. Look again once the workload has run for a while.
The report reflects what is cached now, not what has ever run. A database that ran heavy ad hoc work an hour ago and was then evicted will not show up as you remember it.
For the full column reference, see the Plan Cache By Database documentation. It is an instance level report, so it is a different page from Plan Cache, which is database level and covers one database's cached plans. For the rest of the memory picture, open the Memory report. CPU by Database gives the other per database split of the cache.
What to check on your own server
- Open the cache split by user database and note which database holds the biggest slice
- Compare that database's Queries in Cache against its Cache Used to see whether it holds a few big plans or very many small ones
- Compare each large slice against the size and activity of its database, and question any small, quiet database holding a big share
- Drill into Plan Cache for the suspect database and check how often each plan has been used
- Run One Time Use Queries by Database to see how much of that memory will never be reused
Try Database Health Monitor Today
It shows which database is holding your plan cache memory, and whether that memory is big plans or ad hoc statements nobody will ever run again. Database Health Monitor shows it on every instance you connect, in the time it takes to open the report.
Download Database Health Monitor and run the Plan Cache By Database report against your own server. There is nothing to configure first, and you will know inside a few minutes whether it tells you something you did not already know.