Who Is Connected to SQL Server, and What They’re Doing
By Thursday afternoon, the connection pool refuses new work. An application that ran fine all week suddenly throws "Timeout expired. The timeout period elapsed prior to obtaining a connection from the pool." Restarting it clears things for a day, then it happens again. Nobody touched the code. Nobody changed the traffic. Before touching pool size or timeout settings, the real question is who is connected to the server right now, and for how long.
How do I see who is connected to my SQL Server right now? A connection pool that fills up over days, not seconds, is usually not too many connections – it's too many idle ones. Sessions that opened a transaction or a connection and never let go pile up quietly. Before assuming you need a bigger pool, check who is connected right now and how long each session has actually been idle.
The obvious first move is sp_who2, or Activity Monitor, or just watching a connection count climb on a dashboard somewhere. That number lies more than it helps. A single application can hold several physical connections per session when MARS is involved, so the count on screen can run well ahead of how many things are actually talking to the server. And a flat list of connections doesn't say which ones are asleep, which ones are stuck mid-transaction, and which ones have been sitting open since last Tuesday. In that list, they all look the same.
Who is connected, and for how long
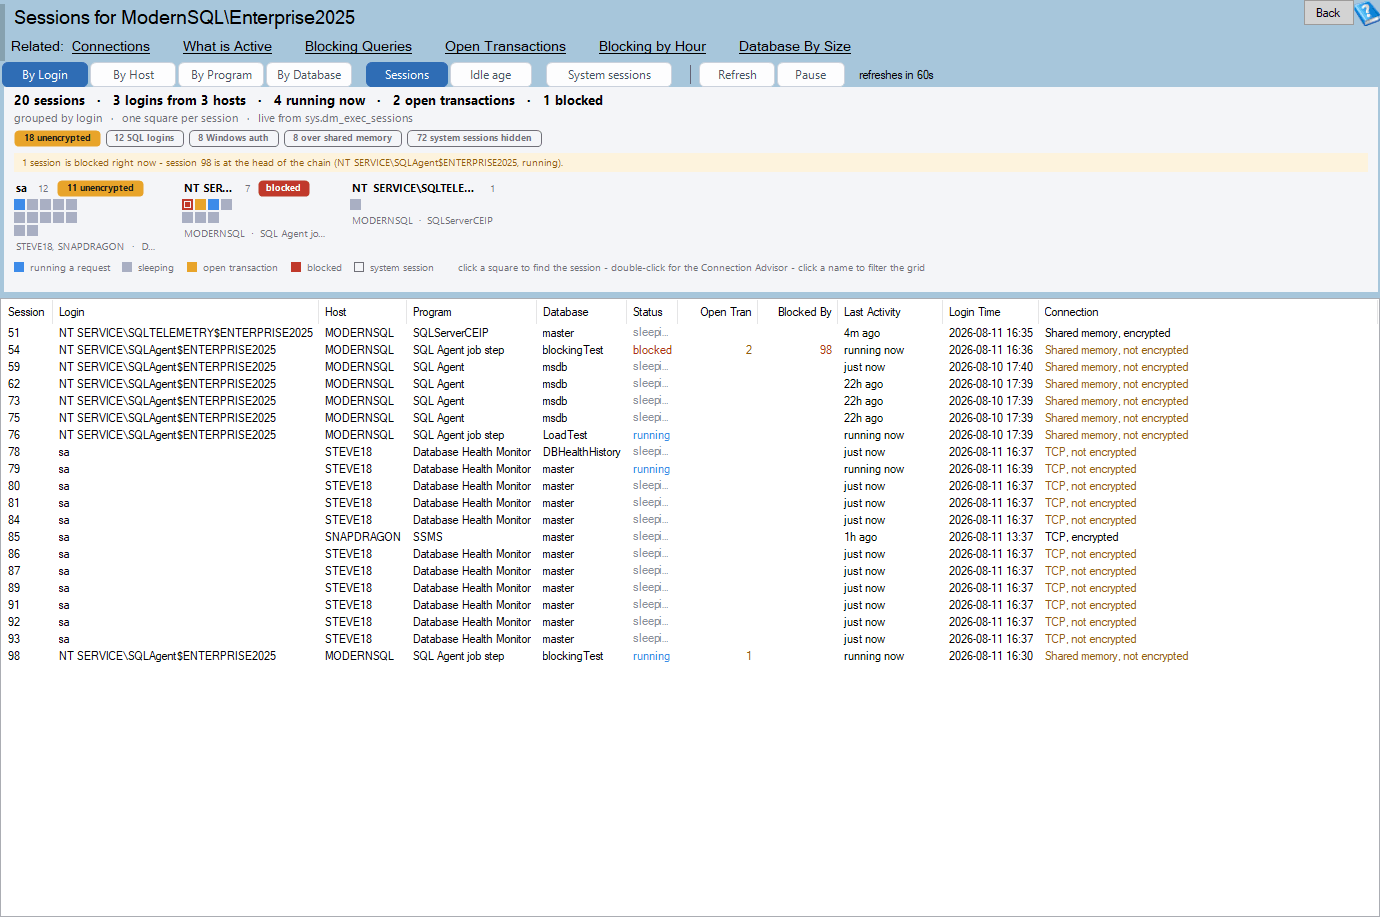
That's the job the Sessions report in Database Health Monitor is built to do. It draws one square per session on a unit chart, grouped into blocks by login, host, program or database, and colors each square by what that session is actually doing right now. Two hundred sessions look like two hundred squares – not a single number that could mean almost anything.
Sessions is one of the reports in Database Health Monitor. It runs against your own servers, and it takes about a minute to have this same screen open on one of them.
One square per session, colored by what it's doing
Every square is one session, not one connection, and its color carries the state: sleeping, running, holding an open transaction, or blocked behind someone else. States are ranked worst to best, so a session that's both blocked and sitting on an open transaction reads as blocked – that's the one somebody actually has to act on. As the session count climbs, the squares shrink instead of vanishing, stepping down through a few sizes until, past six thousand sessions, a block gives up on squares entirely and shows a bar with a number on it. A summary line across the top adds it all up – something like 180 sessions, 9 logins from 22 hosts, 3 running, 5 open transactions, 1 blocked – so the state of the whole instance is one line, not a spreadsheet.
| State | Meaning |
|---|---|
| Sleeping | Connected, but not running anything |
| Running | Actively executing a request |
| Open transaction | Idle, yet still holding a transaction open |
| Blocked | Stuck waiting on another session |

Idle age finds the leak
Switch the shape from Sessions to Idle Age and the same squares get replotted on a logarithmic timeline, ordered by how long it's been since each one last did anything. The axis stops at one week; anything older piles up on the last tick. A tight cluster of squares sitting at that right-hand edge, all from the same program, is exactly what a connection leak looks like – sessions that were opened, used once, and never closed. A pile of sleeping sessions from one program isn't automatically bad; connection pooling is supposed to look a lot like that. Idle Age is what tells the two apart: pooling refreshes, a leak just accumulates.
Patterns worth recognizing
- A pile of sleeping sessions from a single program – fine if their idle ages are short and spread out, worth digging into if they're all old
- A lone sleeping session anchoring a blocking chain – usually an application that opened a transaction and never came back to close it
- A stack of open transactions with nothing actually executing – look at how the client handles transactions before blaming SQL Server
- A sudden burst of new squares between one refresh and the next – something is opening connections faster than it can close them
Blocking gets its own line
When something is blocked, the report doesn't make you go hunting for it – an amber strip appears above the chart, naming the session at the head of the chain along with its login, host and program. That matters because the head of a blocking chain is usually a sleeping session that looks like every other sleeping session in the chart; nothing about its color gives it away without that strip pointing at it. With more than one chain running, it names up to three heads at once.
9 sessions are blocked right now – session 212 is at the head of the chain (batch_svc, sleeping).
Killing a session without guessing
Right-click a session and Kill Session is on the menu, but it doesn't fire immediately – it confirms first, naming the login, host and program, and if that session is holding a transaction it says so, because rolling that transaction back can take far longer than the kill itself. A failed kill surfaces as a message box telling you what SQL Server said, rather than disappearing into a log somewhere. For clearing out a whole application's worth of leaked sessions at once, there's a bulk option too, but it only ever copies a commented KILL statement per session to the clipboard for reading and running yourself – not something that happens with one click on thirty sessions.

None of this replaces watching the pool itself, but a leak announces itself here long before the pool actually empties: the same program, the same idle age, growing block after block. If the running squares turn out to be the real problem instead – not sleeping, not blocked, just busy – that's a wait-time question rather than a connection one, and it's covered separately in SQL Server Signal Wait Time: The Metric Everyone Skips.
What to check on your own server
- Group idle sessions by application name and compare last request times to spot which program is leaking connections
- Query sys.dm_exec_sessions joined to sys.dm_exec_requests and note how many sessions show a nonzero open_transaction_count
- Check blocking_session_id in sys.dm_exec_requests to find the head of any blocking chain
- Note how many sessions are using SQL logins versus Windows authentication before your next security review
Try Database Health Monitor Today
It shows exactly which sessions are holding your connection pool hostage, and for how long, so you stop guessing at restarts. Database Health Monitor shows it on every instance you connect, in the time it takes to open the report.
Download Database Health Monitor and run the Sessions report against your own server. There is nothing to configure first, and you will know inside a few minutes whether it tells you something you did not already know.