Inside Database Health Monitor 4.1540: 63 New Reports, 25 Features and 515 Fixes
Database Health Monitor 4.1540 is the largest release the product has shipped. Sixty three new reports, twenty five new features, and five hundred and fifteen bug fixes went into this build, and the work behind those numbers falls into a small number of themes: knowing which server you are actually looking at, moving results out of the product and into whatever you use next, and closing out a long list of places where the answer on screen was quietly wrong. This post walks through what changed, report suite by report suite and fix category by fix category, so you can see exactly what landed and why it matters on your own instances.
The release at a glance
Sixty three new pages arrived in this release. Twenty five of them are a new Query Store suite in Database Health Monitor, fifteen are a new SSRS suite in Database Health Monitor, and the remaining twenty three are new plan, workload, capacity and storage pages in Azure SQL Health Monitor. Twenty five new features touch connections, everyday use, backup and restore, Quick Scan, and the reports and tools menu. And five hundred and fifteen bug fixes went into behavior that was quietly wrong: a page measuring time on the wrong clock, a script that would not run against a name with a bracket in it, a grid whose verdict column sat off the edge of the window. The sections below take each of those in turn.
The Query Store suite: twenty five new reports
Query Store has been part of SQL Server for years, but most of what it captures never made it into a report of its own. This release adds twenty five pages to Database Health Monitor that are built entirely on top of Query Store, and together they answer questions that used to require writing a query against the Query Store views by hand.
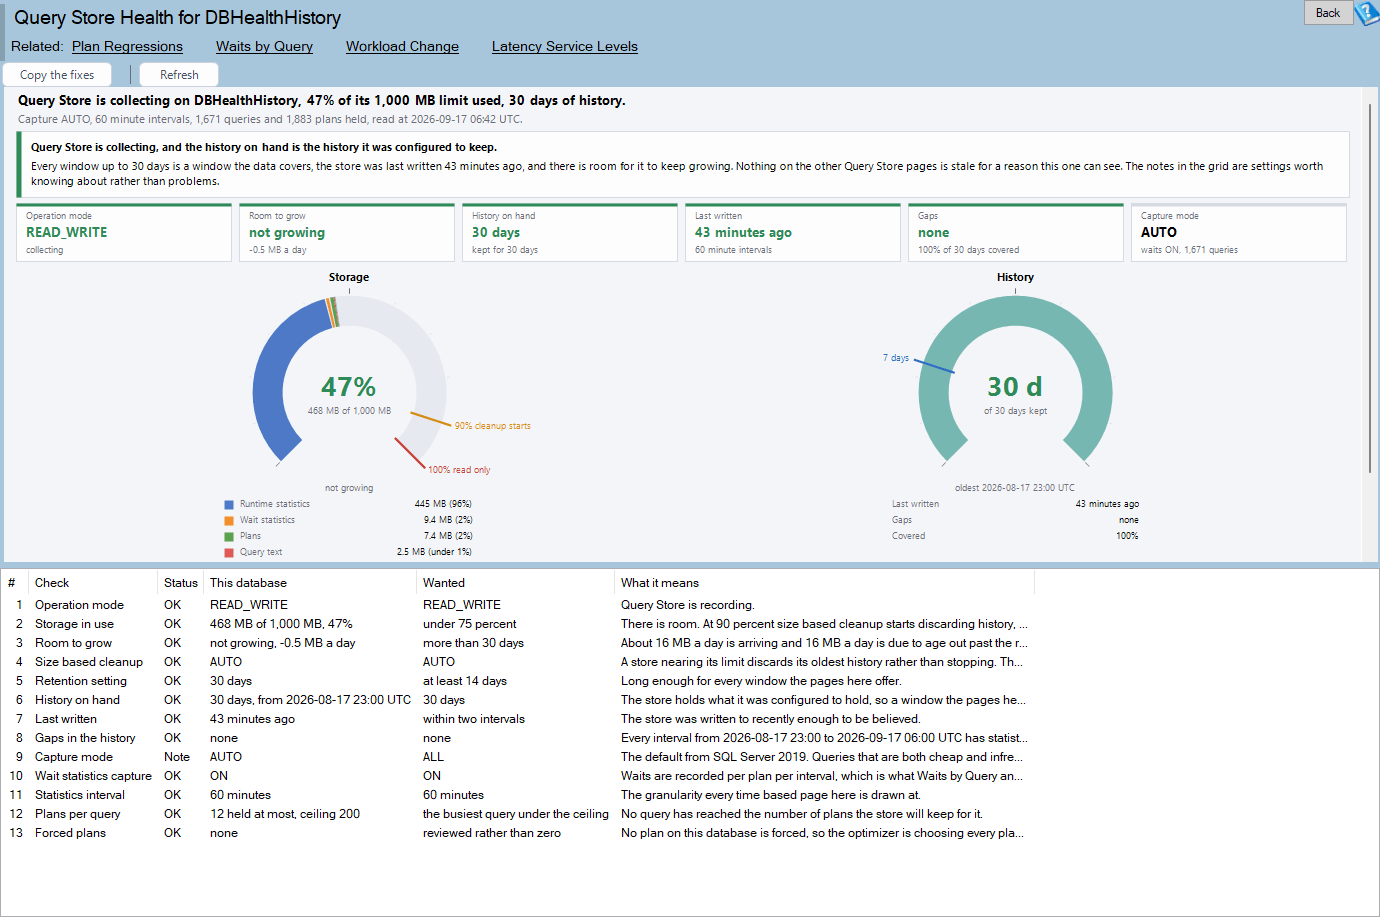
Start with the state of Query Store itself. Query Store Health tells you whether Query Store is still collecting and whether the history it claims to hold is actually there, which matters because a report built on top of Query Store is only as good as the data underneath it.
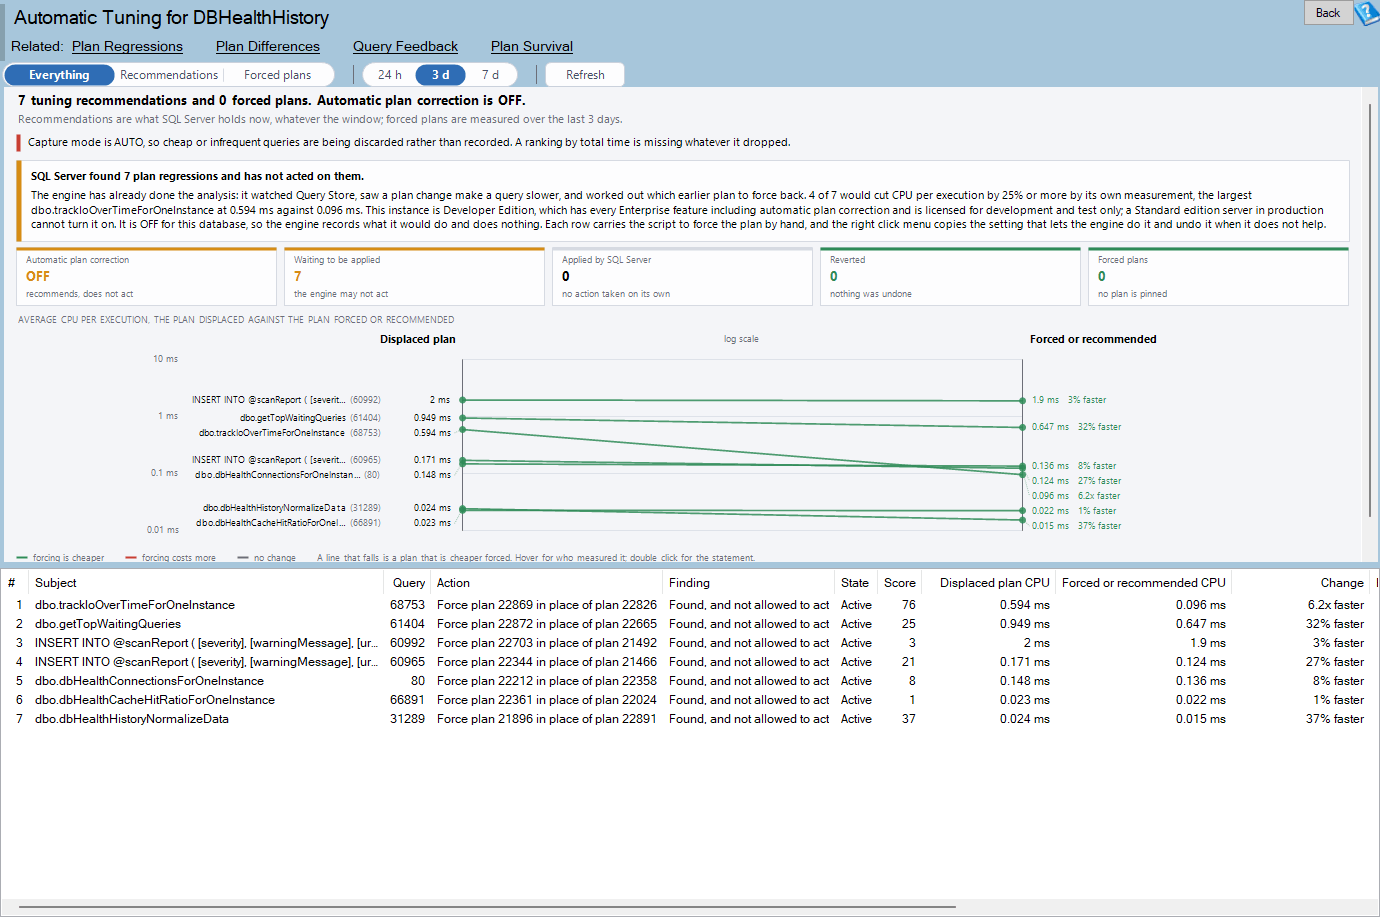
Automatic Tuning shows the plan regressions SQL Server found on its own and whether it was allowed to force the earlier plan back. If you have Automatic Tuning turned on and have never actually looked at what it decided, this report is the missing piece.
A cluster of new reports is about whether a query’s cost is actually changing, and by how much. Change Significance answers whether a query’s change in duration or CPU is larger than its own run to run variation could produce on its own, which is the difference between a real regression and normal noise. Cost Drift tracks whether each busy query still costs what it used to per execution, and when that changed. Deployment Impact shows what each procedure, function and trigger cost before and after its own deployment, so a code change and its performance consequence sit on the same page. Performance Baselines flags queries whose recent readings break limits drawn from their own earlier history, rather than from a fixed threshold that fits nothing well. Workload Change compares what changed between two windows of the same length, one query at a time.
Plans themselves get their own set of reports. Plan Differences shows what is actually different inside the two plans a statement has been running, operator against operator, rather than just telling you a plan changed. Plan Resource Profile puts two plans for one statement side by side across all eight resources Query Store keeps. Plan Survival answers how long a plan lasts before the optimizer replaces it, and which queries change plans most often. Query Feedback lists every correction SQL Server 2022 has made to a plan on its own, including the ones it tried and then took back. Parameter Sensitive Plans checks whether each statement SQL Server 2022 split by parameter value actually got a split that changed anything, which is useful for confirming the feature is doing real work rather than just splitting for its own sake.
Indexes and access patterns get direct attention too. Key Lookups shows which indexes are sending the busiest plans back to the table, which columns they went back for, and what a covering index would remove.
Residual Predicates shows which seeks and scans read rows only to throw them away, and where in the key the column responsible for the throwing away should sit. Batch Mode Candidates finds busy queries that are still running one row at a time and estimates what batch mode would be worth for them.
Timing and load round out the suite. Hourly Drift identifies which hour of the day is getting heavier or slower than that same hour used to be. Load Sensitivity separates queries that are only slow when the database is busy from queries that are slow on their own. Latency Service Levels checks whether queries finish within a target you choose, and which ones miss it most often. Throughput and Latency Headroom shows what an execution costs at each level of load, and where the cost passes twice the quiet baseline. Duration Spread flags queries whose worst case is pulling away from their typical case. Slow Periods reports when the database ran slower than usual, and whether the queries running then brought the work with them or were only held up by something else. Timeouts and Failed Executions lists the executions that were aborted by the client or ended in an error, and the time they threw away.
A few reports round out the suite by looking at things that do not show up anywhere else. Rank Movement shows which queries are climbing toward the top of the ranking before anybody has complained about them yet, which is about catching a problem before it becomes one. Session SET Options lists statements that were compiled more than once because callers connected with different SET options, a classic and hard to spot cause of plan cache bloat. Statement Hot Spots finds which statements inside a busy procedure, function or trigger run far more often than the module around them, which is what a loop looks like from the outside.
The SSRS suite: fifteen new reports
If you run SQL Server Reporting Services alongside your databases, this release gives it the same kind of attention Query Store just got. Fifteen new reports cover the report server catalog, its execution history, its subscriptions, and its own configuration.
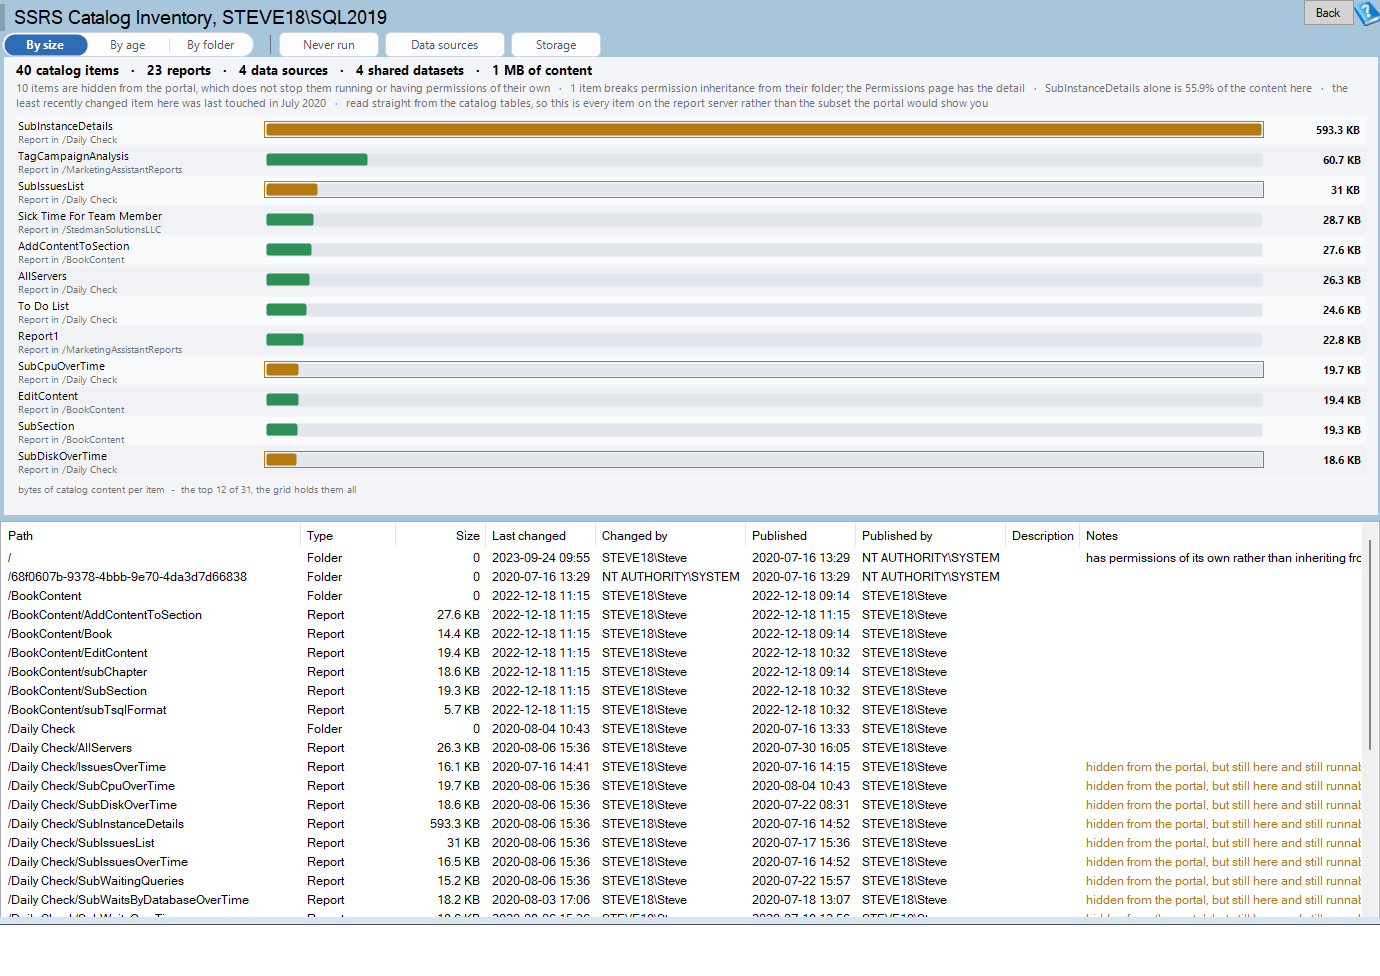
SSRS Catalog Inventory lists everything published to a report server, who published it, and how much of the catalog each item accounts for. SSRS What Fills This Database takes the same idea to the storage layer and shows what every table in the report server catalog and its temp database holds, in plain words rather than raw table names.
Execution and delivery get their own cluster. SSRS Caching and Execution shows how every report on the server is set to execute, and flags slow, busy reports that are not cached. SSRS Failed Executions lists every report and status pairing that did not end in success, including runs that failed while nobody was watching. SSRS Delivery History shows which subscriptions fail to deliver and the message each attempt left behind. SSRS Delivery Queue is a live view of what the report server is doing right now, and what has waited long enough to be called stuck. SSRS Subscriptions covers everything the report server sends out on its own, and flags which subscriptions have quietly stopped working, with enable, disable and delete scripts sitting right on the grid. SSRS Schedules shows which schedules drive nothing, have expired, or have stopped moving forward, and whether the Agent job behind each one is even enabled.
Data and permissions get direct treatment. SSRS Data Sources shows how each data source gets its credentials, and flags which ones will break a subscription because they cannot supply credentials unattended. SSRS Shared Datasets lists which reports use each shared dataset, and which datasets nothing uses at all. SSRS Report Parameters puts every report’s parameters in one grid, and flags reports that cannot be scheduled because a required parameter has no default. SSRS Permissions lists every role assignment, the items that break inheritance from their folder, and the users who no longer have access to anything.
Housekeeping is covered too. SSRS Never Run lists the reports, shared data sources, shared datasets and empty folders that nothing has used within the execution log’s retention window, which is exactly what you want before a cleanup. SSRS Snapshots and History shows what the stored renderings weigh and which ones nothing points at or that have expired. SSRS Server Configuration lists every setting the report server keeps, compared against its shipped default, so a change made months ago and forgotten about is easy to spot.
Azure SQL Health Monitor: twenty three new reports
Azure SQL Health Monitor picked up twenty three new reports this release, and they lean heavily into the questions that only come up on a governed platform: what the service tier is actually limiting, what the platform is doing beside your own workload, and what billing is really charging for.
Statistics and plans get a close look. Ascending Keys and Rows Past the Histogram finds statistics whose histogram stops before the data does, and shows what the optimizer is guessing about the rows beyond it. Optimizer Search Depth and Plans Cut Short measures how much work runs on plans whose search was ended early by a timeout or by running out of memory. Parameter Sensitive Plans and Whether Each Split Pays checks whether a call on either side of a boundary the optimizer drew actually runs a different plan. Query Store Hints and Whether Each Still Pays checks whether each Query Store hint is still applied, and compares a call’s cost with the hint against without it.
Resources on a governed tier get their own set of pages. Memory Allowance and What Holds It shows who holds the memory the service objective pays for, and how much the database could give back. Data File Space and What a Shrink Would Release draws a map of each data file showing how much is allocated and unused. In-Memory Tables and Hash Bucket Sizing checks memory-optimized tables against the tier’s limit and whether each hash index has the buckets its keys actually need. Resource Rooflines identifies which of the service objective’s two allowances is the one standing in front of each query. Resource Coupling and Which Limits Rise Together shows which governed resources are busy at the same moments, which take turns, and which is busy entirely on its own.
Load and capacity are covered from several angles. Peak Load and the Queries That Size the Tier shows which statements the busiest stretch of the window is made of, and how much lower the peak would be without each one. CPU Run Queue and Who Waits for a Processor shows how deep the queues behind the schedulers ran, and which statements are standing in them. Compute Accounting and the Work No Query Explains quantifies how much of the processor time a database is charged for belongs to no statement Query Store recorded at all. Latch Contention and the Structures Behind LATCH Waits names the internal structure each latch wait protects, so a LATCH_EX at the top of a wait list turns into a pattern with a name and a fix. Client Waits and Results Left Unread shows how long statements waited for their own clients to take the rows they had ready, and which applications are waiting right now.
Backup, replication and platform accounting close out the suite. Backup Schedule and the Point-in-Time Restore Window shows which automated backups the platform took, whether log backups kept their cadence, and how far back a restore can actually reach. Replica Lag and What Commits Wait For shows how far behind the primary each replica is, and how long writers were held back because a replica could not keep up. Elastic Pool Neighbors and Who Uses the Shared Allowance shows who in an elastic pool uses the room the pool is paid for, and whether they use it at the same time you do. Serverless Billing and What Keeps the Meter Running shows what the serverless tier actually bills for, stretch by stretch, and which of the three billing rules was the one on top. Workload Groups and What the Platform Runs Beside You breaks down who spent the CPU, reads, writes and log of the instance: your queries, another database’s, or the platform’s own work. Commit Batching and What Each Log Flush Carries shows how little each log flush carries against a 60 KB log block, and which statements commit a row at a time. Change Tracking and What Cleanup Leaves Behind shows what change tracking keeps in its side tables and whether the cleanup meant to bound them is actually running. Temporal History and What Versioning Keeps shows how much history each system-versioned table keeps against the table itself, and whether a retention setting is holding it back. Resize History and What Each Change Bought shows every time the database changed size, and whether the change bought anything the workload actually used. Performance Counter Ratios and the Rules of Thumb brings the classic Performance Monitor ratios back, measured over a live sample rather than averaged since startup.
New features
Twenty five new features shipped alongside the report suites. The theme running through them is knowing which server you are looking at, moving results out of the product, and keeping backup and restore scripts right.
Connections and servers
Server types are the headline feature here. You can now tag each connection Production, Test, and so on, and the type shows as a color chip in the server tree, where it can be used to sort and filter. When a new connection would be hidden by the current type filter, the product now offers to show all types instead of just hiding it silently. Edit Connection lets you change a saved connection in place instead of removing it and adding it back. License and instance limit state is now shown in a dismissible strip, servers past the instance limit are no longer dropped silently, and the registration dialog gives a message per field rather than one generic error. Settings shared between programs now work properly too: a running program re-reads the settings file when another copy has saved it, so an instance added by a second copy is listed without a restart, and saves are atomic and wait out a busy file rather than colliding with it.
Everyday use
Export to files is one of the most requested features in this release. Grids, charts and pages can now be exported as CSV, HTML and PNG, which means results can move into whatever else you use, whether that is a spreadsheet, a ticket, or a report for someone else. Remembered layout means the main window position and size, the navigation tree width, and the column layout of the key report grids are remembered between sessions, so the product looks the way you left it. A single time window control now appears consistently on the reports that have one, with a global default, instead of each page having its own separate version of the same control. Find and shortcuts adds a find bar with Ctrl+F and a row count to grids, a Keyboard Shortcuts list that shows the keys, and accessible names on the shell controls. Live panels now say when they last updated, reconnect and retry on their own, and stop querying while the window is minimized, so they are not doing work nobody is watching. The Fragmented Index Advisor now shows elapsed time and progress, can be stopped, refuses a second start, and warns before it is closed mid run. The main window’s minimum size can no longer be larger than the screen it is on, and the window size is shown while it is being resized. The Guide Me tour also received a round of bug fixes and improvements.
Backup and restore
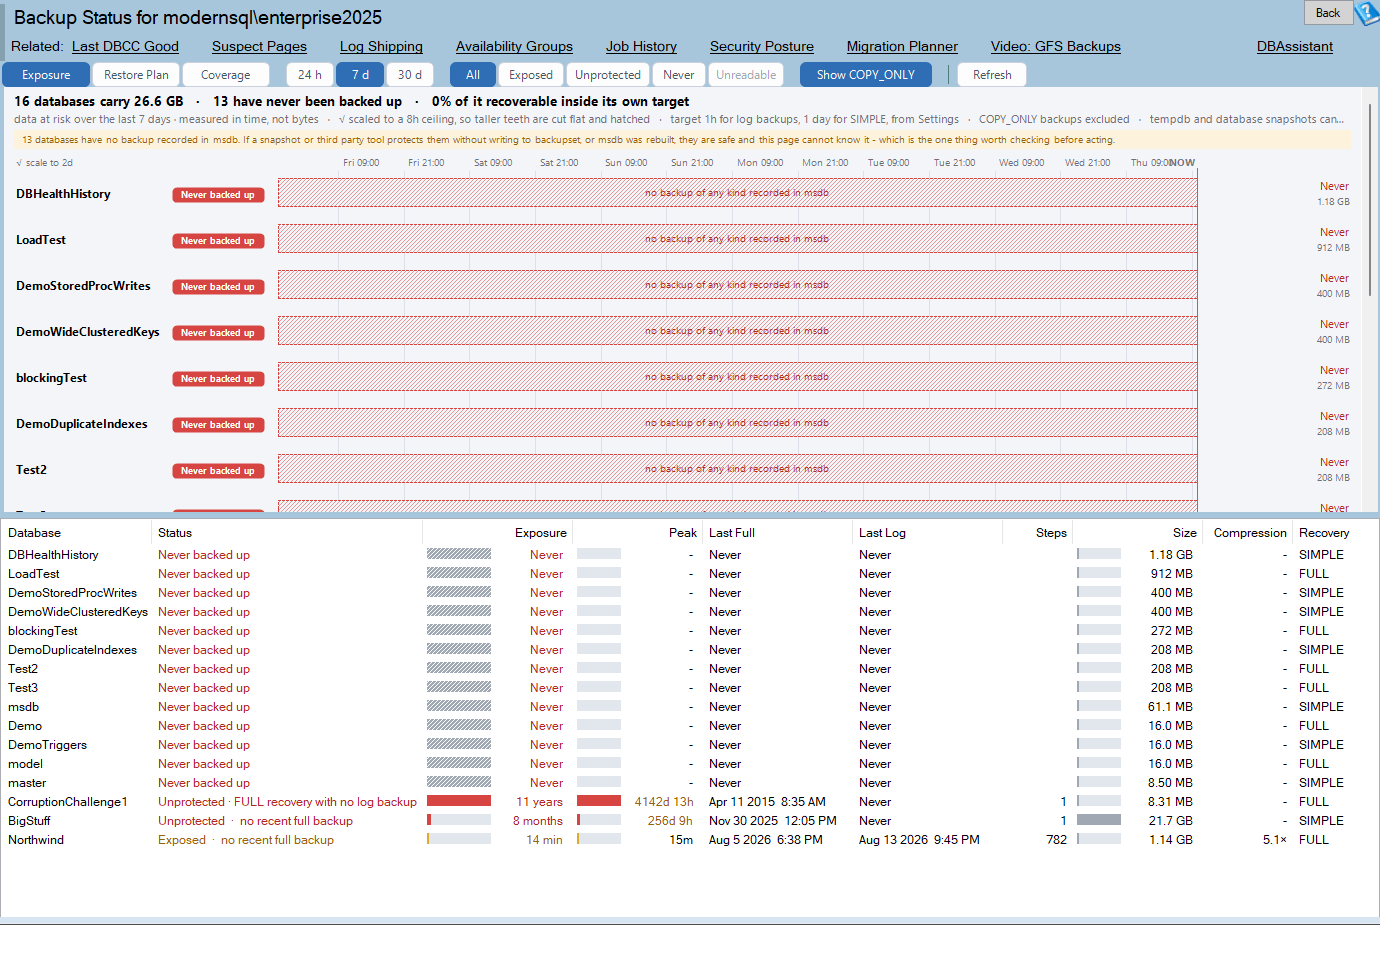
Backup Status now copies the complete restore sequence with every file name in one action, rather than requiring you to assemble it by hand. Backup Advisor restores a striped backup with a single RESTORE rather than one per stripe, and Backup Size and Backup Time Frames now list a striped or mirrored backup once instead of once per file. Backup Advisor also takes new file locations and writes the MOVE clauses for them automatically. Backup Time Frames can open the Backup Advisor for a backup directly, carrying the original restore script with it. Log Viewer now lists the log backups of the selected database. Backup Status itself is faster on instances with a large backup history. Log shipping settings can be changed for a chain that does not need log shipping set up again from scratch, and a right click now shows the backup or restore history for the database. The Stedman log shipping procedures are now distributed in the DBHealthHistory database as well.
Quick Scan
Quick Scan picked up new checks this release. It now warns when the instance backup checksum default is not 1, when Query Store is not enabled, and offers to schedule the Ola Hallengren jobs from check 238. The outdated build check now knows about SQL Server 2025 as well.
Reports and tools
A right click on the SSRS pages now downloads the RDL, RSD and RDS files, and a right click on the SSIS grids downloads the DTSX package, both without leaving the product. The tray icon now shows service health, and notifies when monitoring fails or SQL Server is restarted automatically, so you find out about a restart from the tray rather than from a user complaint. Decryptionator now lists, reads and decrypts database DDL triggers in addition to what it already handled. Historic rebuild reports what went wrong: an error during a history rebuild is now reported with its detail instead of a bare failure, and repeated upgrade steps are skipped when there is nothing to do. Finally, the Express scheduler and the component tester, both obsolete projects, were removed from the solution entirely.
Five hundred and fifteen bug fixes
Most of this release is behavior that was quietly wrong: a page measuring time on the wrong clock, a script that would not run on a name with a bracket in it, a grid whose verdict column sat off the edge of the window. Five hundred and fifteen tickets were closed, and they group into a handful of categories worth walking through individually, because the categories say more about what changed than the raw count does.
Crashes and exceptions
A large share of this work was about not reporting a crash for something that was never a bug in the code. A rejected login, a TLS or SSL handshake failure, a toast notification with no window behind it, a redraw on an instance with no main form, and the Rewards page when the licensing service cannot be reached were all previously logged as crashes, and none of them are the product misbehaving. Starting the application without an interactive session no longer files a crash report from the splash screen either, and Azure SQL Health Monitor no longer exits at startup in that situation. Test scripts hosting the assemblies no longer file crash reports.
Real defects were fixed too. DataCache threw a missing key error when two workers expired the same entry at once, and could spin forever when two threads tried to add the same key. The startup license check threw an exception inside its own Catch block. Job History, Connections by Database, and the instance reports menu threw NullReferenceException, or left a reader open on the shared connection. Navigating between pages leaked Labels and window handles until the process eventually failed with “Error creating window handle.” A right click on a report grid threw OverflowException in the 64 bit build when the screen position was negative, and several tool menu items threw ArgumentOutOfRangeException. Quick Scan Deep Scan crashed when a check timed out, and threw a “Collection was modified” error when a lane was still reading at the timeout. Cardinality Report crashed when a count timed out, and divided by zero on a table without columns. Ignore Waits, Technical Debt settings, Backup Size, Historic Waits and Historic Version all had crashes triggered by a blank or missing value, a double click on empty space, or an empty result set. A settings value holding an unpaired surrogate or a control character made every later save fail, which is exactly the kind of bug that looks unrelated to whatever you were doing when you hit it.
Silent failures and misleading results
This category is arguably the most important one, because a silent failure is worse than a crash: nothing tells you anything went wrong. Quick Scan fixes and the license key dialog both reported success when the change had actually failed. Quick Scan fix dialogs now report the failure honestly, and entering a license key no longer closes the dialog when the key could not actually be written. A connection added, edited, removed or imported was lost silently when connections.xml could not be written, and a connection list that could not be read was overwritten rather than preserved. Email alerts no longer send a message without its attachments when they could not be read, and the queue never re-sends a message the SMTP server already accepted. Update All Historic Databases used to report an unreachable or stuck history database as checked and up to date, which is precisely backward. Overview panels used to keep re-running a query the login could not run; they now stop and say the login lacks VIEW SERVER STATE, and show “not read” rather than a verdict when a read fails, instead of guessing. Query Store Health used to report a healthy store as empty or stopped when a read simply timed out. Query Loading Ramp’s headless mode ran zero queries and exited 0 when given a parameter file with no data rows, which would have looked like a clean successful run in a scheduled task. Download latest version did nothing at all when the installer zip was unreadable, with no indication of why.
Wrong answers
Time measured on the wrong clock affected a surprising number of pages. Ages, uptime, recency and time windows were being measured on the workstation clock instead of the server’s clock on the Index reports, Connections pages, msdb reports, SSRS and SSIS pages, Error Log, Server Overview, Memory Ladder, CPU and IO by Query, Missing Index, and the Event Studio, Log Reader and PageWalker tools. That is a wide blast radius for one class of bug, and it means numbers on those pages could have been off by however far your workstation’s clock and the server’s clock had drifted apart.
Dates and regional settings caused their own family of bugs. Historic queries and generated scripts now send dates in the invariant culture. Job History and the msdb purge scripts use yyyyMMdd. Growth Trend, Rank Movement and several other pages now cut days in the reader’s local time zone rather than an arbitrary one. Pages no longer break under a non-colon time separator or a non-English SQL login language, which matters a great deal if your SQL Server is not running under US English settings.
Units and arithmetic were also a real source of wrong numbers. Total Memory was converting KB to GB using 1000 instead of 1024. IO by Hour hover text overstated IO by a factor of 1024. Log Viewer always showed a compression ratio of 100 regardless of the actual data. Several time formatters mis-rounded minutes and sub-second values.
Backup and restore answers had several fixes that matter a lot if you rely on this product to plan a real recovery. Restore plans were over-counting log backups when a differential applies, judging restorability from the newest full backup rather than the base full, and taking the file check from a COPY_ONLY full backup. Backup Size dropped COPY_ONLY backups from its totals. Backup Time Frames drew a backup that crossed midnight starting from the far left edge of the chart instead of where it actually started. Growth from Backups and Backup Speed were mixing in backups that had been restored onto the current server from another server, which is not the same thing as a backup taken here. In the Corruption Response Kit, point in time scripts no longer restore a differential that finished after the stop time, or apply log backups taken before the differential. Heap salvage now correctly finds the heap’s pages, and salvage scripts work correctly on identity and rowversion tables.
Index reports had a batch of accuracy fixes as well. Duplicate and Unused Indexes now compare the sort direction of each key column, and no longer pick a disabled index as the keeper of a duplicate pair. Index Review, Problem Indexes, Large Tables and Index Fragmentation had wrong counts, wrong fill factors, or one row per partition where there should have been one row per index.
Quick Scan scoring got several corrections. Checks that could not run are now left out of the score rather than counted against it. The SQL Express file limit checks now use the version dependent limit and add up data files only. The Huge Error Log check can now actually fire. Several checks were reporting the wrong row count, the wrong check number, or failing outright on unusual database names.
Query Store pages had several verdict corrections. Plan Survival no longer reports “Forces not holding” for a forced plan that is actually current. Workload Change now compares windows holding the same number of complete intervals rather than mismatched windows. Rank Movement no longer marks every quiet period as partial. Deployment Impact and Schema Changes now count only the Query Store time they were actually measured over. Plan Differences no longer names a change that is really just a plan warning.
Deadlocks, blocking and sessions had their own set of fixes. Multi-cycle deadlock reports were labeling every victim after the first one as a Winner. The blocking heat map was scaling by percent_rank, which made a five second blip look like a peak. Active Blocking missed cycles and chains that were headed by a session it could not see. Grids showing two requests or two transactions inside one session were showing one of them twice. Historic Waits charts added an extra day, or dropped the last day, at several zoom levels, and the Year zoom scrolled by the wrong interval. Technical Debt was counting matches with LEN instead of DATALENGTH, skipped several checks, and dropped the last line of each syscomments row.
Generated scripts
A name with a bracket or an apostrophe in it used to break generated scripts across Schema Drift, Problem Indexes, Columnstore, Partitioning, Quick Scan, VLF Advisor, Decryptionator and the report queries. All of those now double a closing bracket, quote with QUOTENAME, and pass names as parameters instead of splicing them directly into T-SQL, which is both the correct fix and the safer one.
Rebuild and undo scripts got real attention too. LOB Columns rebuild scripts now carry the index’s own options and write ON [scheme]([column]) for a partitioned index. The Space Recovery VLF script rebuilds every log file rather than just one. The clustering key script keeps DESC where the original key had it. The foreign key health script writes one CREATE INDEX per distinct column list instead of duplicating them. Log Reader’s undo scripts now produce statements that actually run for a table with no primary key, and for a modification on computed, rowversion or dropped columns, cases that previously generated a script that would fail.
Data Compare had several fixes. The sync script now only re-enables triggers that were actually enabled to begin with. Large text columns are no longer reported as changed when only DATALENGTH differs. Float values now compare exactly rather than approximately. A DELETE is no longer scripted for a row whose large value could not be read in full, which previously risked deleting a row based on incomplete information.
Schema Drift had a set of correctness fixes: CREATE OR ALTER no longer becomes an invalid ALTER OR ALTER, UNIQUE constraints now compare as their own object type, permission, table, key and contract scripts carry the attributes that actually change behavior, and same named objects in different schemas are no longer merged together as though they were one object.
Layout, scaling and drawing
More than 150 grids, charts, footers and dialogs had a column, caption or button pushed off the edge at 1280×900, 1600×900, or 125 to 150 percent scaling. The verdict or advice column of the SSIS, SSRS, Query Store, msdb and index pages is now on screen without having to scroll sideways to see it, which sounds small until you have actually hit it on your own monitor. Charts and panels that used to vanish or get painted over when the detail pane, an ad, or the assistant narrowed the page are fixed, including Security Posture, Quick Scan, Deadlock and Failed Jobs lanes, and the Replication toolbar. A number of drawing leaks were also closed: dozens of chart controls, TimeGraph, EnhancedListView and several panels were creating fonts, bitmaps, brushes and tooltips on every redraw or resize and never releasing them, which is the kind of bug that shows up as the application slowly getting heavier the longer it stays open.
Connections, settings and history
Settings and connection saves are now atomic, serialize access between processes, and no longer overwrite a change another program made. The recent servers list is now saved bar separated, so a server written with a port number is no longer split incorrectly. Connect strings now quote the database name, and the Connect dialog no longer quotes a SQL authentication password twice. Historic monitoring got several fixes: retention days of 0 now means keep forever, alert procedures handle white space in the ignore list, index usage tracking copes with databases in a restoring state, and the Tray history honors escaped pipes so long messages display correctly instead of being cut off. Tray passwords for SMTP and server connections saved by the Tray are now readable by the LocalSystem service, which had previously been unable to read its own stored credentials.
Azure SQL Health Monitor
Microsoft Entra sign in got several corrections: the Tenant ID is now applied to service principal, interactive and device code sign in, and a device code with a blank Tenant ID now shows the user code instead of failing silently. Retries and reloads were tightened up too: a statement that timed out or was already sent is no longer repeated, a reload during the first load of a page is ignored rather than acted on twice, and a typed password is only kept after it actually worked. Several wrong verdicts were corrected: replication waits were being counted as throttling, the throttling verdict only tested the top eight waits, Top Queries memory was ranking a sum of peaks rather than something more meaningful, and the Plan Regressions verdict said plans did not change when other rows actually did. Connections fixes round it out: import now stops at the license database limit, Edit Connection reloads the open page, Back returns to the report you actually came from, and duplicate connections are refused rather than silently created twice.
What this means for your instances
If you monitor SQL Server on a regular basis, the practical effect of this release is that a large amount of Query Store data you were already paying for in storage now has a report built to read it, the report server sitting next to your databases finally gets the same attention your instances get, and a long tail of small, quietly wrong answers across the product got corrected all at once rather than one at a time over the next several releases. Database Health Monitor 4.1540 is available now, and the upgrade brings all of the above to every connected instance without any additional configuration required to start seeing the new reports.