Download
The first tool you reach for when SQL Server is slow
Database Health Monitor finds the slow queries, missing indexes, and blocking behind performance problems fast. Try it free for 30 days on your own server. No credit card.
Free for 30 days · No credit card · Installs alongside your existing setup
| 1 | Register for your trial. The button takes you to a short form ‐ just your email and name to send the download and trial key. |
| 2 | Download and unzip. Open the zip and run DatabaseHealthSetup.exe. |
| 3 | Connect and scan. Point it at a SQL Server instance and run a Quick Scan to see what it finds. |
Thank you for using Database Health Monitor.
What People Are Saying About Database Health Monitor
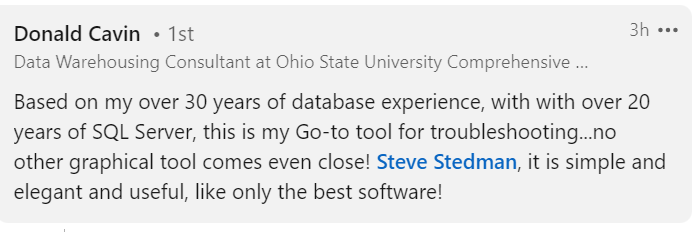
- “I installed Database Health Monitor on many of my client’s SQL servers and believe it’s the best tool out there for SQL monitoring.” – Charles Ray – March 2022
- This is a great application for SQL Server DBAing. We have a web based product but this one is so comprehensive, both high level and detailed. So much is available right at the click of a button, it is amazing! I am so grateful for the application, for the effort to build it, and the decision to share it. I know it has made me a better DBA, my organization has benefited from it, and I deeply appreciate all of that! Thank you! – Jesse – October 2021
- Thank you a lot for this excellent application. I loved the “missing indexes” and “Statistics” section, it helps me to save time and effort for the weekly maintenance.
Best Regards November 2019 - Database Health is the first tool that I pull up when someone calls and complains about slow performance in their applications, that be Dynamics NAV, Dynamics AX or even the webpages running slow. It saves me a lot of time finding the queries, missing indexes or what be it, causing the problem. This is by far the easiest and most effective tool to use, when searching for problems that need instant resolution. Thanx a million for your contribution to the SQL world. September 2019.
- This is an awesome tool to find issues and fix them or improve performance in areas that I didn’t even know we can.
- I would like to thank you for sharing this product with us free. I have installed and using health monitor on my production DB. very very nice…. Thank you so very much. I hope you will keep adding more features in this product. Well done (Rohit)
- Outstanding app. Already referred it to several friends in the field. Well I do have to say the changes you have made (regarding version 2.5), seems to have made everything in the interface much snappier. Your work here is quite impressive. (Frank from Texas)
- Outstanding! Besides enjoying the layout of your app, one thing I really like about the Quick Scan Report is each entry has a corresponding link that discusses the finding so I can go back and review recommendations, cautions, etc. (Michael)
October 2026 Release – Version 4.1792 Release
Export that asks what the file should contain, recovery help for servers that will not connect, a Theme menu with Follow Windows, a right-click filter on any grid cell, a new Quick Scan security check, and 527 fixes.
- 0 New reports (1 new Quick Scan check)
- 8 New features
- 527 Bug fixes
New reports
No new standalone reports this release. One new check was added to the Quick Scan report, split out of an existing security check.
- SQL logins with the password policy turned off (Quick Scan, Database Health Monitor): Lists enabled SQL logins whose CHECK_POLICY is off, so the password never had to be complex, never expires, and the account never locks out after repeated failed attempts. These logins are usually created by vendor install scripts, which is why nobody remembers them. This was part of the weak SQL logins check and is now its own check, so a login with a blank password and a login with the policy off are reported and fixed separately. The blank password check keeps its place and now describes only blank passwords and passwords that match the login name.
New features
8 items. The theme this release is making the application tell you what is going on: why a server is not answering, what an export will contain, and how to get to the rows you want in one click.
Export and grids
- Export asks what the file contains. When a selection, a filter or several tables on the page make an export ambiguous, a small dialog asks what to save: a table, the selected rows, all rows shown, or every row including the ones a filter hides. When there is nothing to ask the export goes straight to the Save dialog. The file gets an About sheet, details and scope text, and the saved message now says what was written and where.
- Right click a cell to filter by it. The grid menu now offers Copy, Show only and Hide for the value in the clicked cell. Show only and Hide set the column filter without opening the filter dialog, and a message reports how many rows are showing and reminds you that Reset Filters undoes it.
- Line charts have axes, hover values and theme colors. The line chart control draws labeled axes, shows the value under the mouse, follows the light and dark themes, and handles long values without clipping.
Servers that will not connect
- A recovery page replaces the bare Server is Not Connected page. The page now names the server, shows the driver message, gives a plain English likely cause, and offers Try again, Edit connection, Copy error and Help. A successful Try again reloads the report you asked for. An instance that is still connecting shows Connecting with the actions disabled instead of a failure.
- Server tree badges and Retest connection. A server that could not be reached, or that refused the login, gets a badge in the tree with a tooltip saying why and when it last answered, and a Retest connection menu item. The state is learned from the reports you run, so no extra queries are sent, and a server that was merely busy is not badged.
Appearance and accessibility
- Theme menu. Display > Theme offers Light, Dark and Follow Windows. Follow Windows changes the application live when the Windows app mode changes, and an existing dark mode setting is carried over.
- Accessible names for the 10x controls. Charts, report cards, the navigation tree, the grid, the filter boxes and the range picker now expose names, roles and states to screen readers, a chart exposes its headline and each value, and Windows high contrast mode selects a system color theme. The self check now fails when a focusable control has no accessible name.
Decryptionator
- Responsive module list and source view. Loading the module list and View / Decrypt Source now run in the background with progress and a Cancel button, so the window stays alive while the server works, and closing the window during a load stops it cleanly and releases the dedicated administrator connection.
Bug fixes
527 tickets fixed, including 29 crash reports and 188 fixes in Azure SQL Health Monitor. The largest group is Quick Scan checks that gave wrong or incomplete results on SQL Server 2005 to 2008 R2, availability groups, Unicode database names and case sensitive collations, followed by history database upgrade steps (through version 1791) that deliver fixed procedures to databases already upgraded, the history upgrade failures at version 1494, and the unattended silent report generator, which no longer writes saved connection strings to its log.
October 2026 Release – Version 4.1743 Release
A Query Tuning Workbench, Backup SLA policies with a compliance dashboard, a Default Trace Events report, safer Quick Scan one-click fixes, easier report navigation, and 920 fixes.
- 2 New reports
- 13 New features
- 920 Bug fixes
New reports
2 reports. A backup compliance dashboard and a look at what the default trace has been recording on each instance.
- Backup SLA (Instance reports, Database Health Monitor): Shows every database against the backup terms it is assigned, with the policy, the full, differential and log targets, the current status, and the time each database has spent at risk. Violations are tracked as intervals, so a database that missed its terms overnight shows how long it was exposed, not just that it is late. Databases on unreachable instances are shown as Unknown instead of compliant, and SIMPLE recovery databases are flagged when a log term is set. The report exports to HTML, CSV and Word, and the policy and its targets also appear in Backup Status and Recovery Exposure.
- Default Trace Events (Instance reports, Database Health Monitor): Reads the default trace and groups what it recorded across all databases: data and log file autogrowths and shrinks, DBCC runs, objects created, altered and deleted, and sort and hash warnings. The trace path is found the same way for every report that reads it, including SQL Server on Linux.
New features
13 items. The theme this release is trying a query change safely, holding databases to a backup standard, making one-click fixes reversible, and making the application easier to move around in.
Query tuning
- Query Tuning Workbench (Tools menu). Runs a query with the actual execution plan and STATISTICS IO and TIME, and keeps each run as a numbered variation side by side. Every variation records elapsed time, CPU, reads by kind and by table, rows, memory grant, degree of parallelism, spills, warnings and a plan shape word. Best values are shown in bold and regressions of more than 20 percent in amber. A run happens inside a transaction that is rolled back by default, and the workbench asks first when it finds the query changes data or schema. Queries can be picked from the plan cache, Query Store or history, with a baseline variation V1 built from the cached plan without executing it. Compare shows metric deltas, per table reads, warnings added or removed, and operator changes. The missing index strip can try an index for real inside the rollback (disabled for instances flagged Production, with a typed confirmation) or as a hypothetical index. Sessions save as a .dbhtune file with no connection details, and as a standalone HTML report. Open it from the Tools menu, the Query Advisor, or Tune this query on What Is Active and Plan Cache.
Backup and health
- Backup SLA policies. Define per database recovery point and recovery time terms with Tier 1 to Tier 3 presets and offsite terms, and assign them by database or by pattern. The history database evaluates every database every 15 minutes, back dates when a violation started, and drives the new Backup SLA Violation alert (5035) with an all clear. Alert 5002 is unchanged and now points to the new alert.
- Technical Debt snapshots. Each completed scan is kept, the last scan is shown when the page opens, and it is compared with the one before. A since last scan line, a sparkline, a Change column and a New, Worse, Better and Fixed filter show whether the debt is growing or shrinking.
- Estate health on the Performance Dashboard. Each server card shows the reasons behind its status as chips, a server that does not answer or is not licensed is shown as its own state, low memory and plan cache rules were added, and servers are sorted worst first within each environment group.
Quick Scan
- Safer one-click fixes. Every Quick Scan one-click fix now goes through a confirmation that shows the exact T-SQL, with Open script instead as an alternative. The values being replaced are captured before the change so an undo script is offered, and every change is written to a fix log. Dangerous changes such as the recovery switch and DROP USER get an extra warning, and running a fix on other instances captures and logs each instance.
Navigation and everyday use
- Forward navigation. A Forward button, Alt+Left and Alt+Right, and the mouse back and forward buttons.
- Stop a slow report. A Stop button appears on the loading panel after 3 seconds, and Esc does the same. A Stopped card offers Try again and Go back.
- Copy Link to This Report. Copies a link to the current report that carries the server name only, and a /openreport command line switch opens it. A pasted link also opens from the command palette.
- Server tree menu. Open in SSMS, Copy server name and Copy connection details for SQL Server and Azure nodes, and Ctrl+C on a selected server.
- Recent Messages. The last 50 notifications are kept so a toast that faded can be read again, from Help, the command palette or Ctrl+Shift+M.
- Column filters survive a refresh. A live report that reloads its grid now reapplies the column filters instead of silently dropping them.
- F1 opens the installed help. Help links in dialogs and advisors open the help file installed with the product instead of the web, so they work offline, and Settings opens at the topic for the active tab.
Decryptionator
- Self test mode. A /selftest switch creates every encrypted object type, decrypts it, compares it to the original and returns a pass or fail exit code.
Bug fixes
920 tickets fixed, including 16 crashes and 131 fixes in Azure SQL Health Monitor. Most of the rest are wrong or misleading results in reports and Quick Scan checks on case sensitive collations, Unicode names, large files and Azure SQL Managed Instance, plus several history database upgrade steps (through version 1742) that deliver fixed procedures to databases already upgraded.
October 2026 Release – Version 4.1662 Release
A web dashboard for the monitoring service, an Index Consolidation Plan, new reports for Service Broker, data protection and Analysis Services, faster history collection, and 278 fixes.
- 3 New reports
- 9 New features
- 278 Bug fixes
New reports
5 pages. Two new database pages and their instance roll-ups for Service Broker and data protection, plus an Analysis Services instance report.
Database pages 2 reports, Database Health Monitor
- Service Broker: Queues, activation, the transmission queue, conversations, poison messages and endpoints, so a queue disabled by a poison message, messages that cannot be delivered or leaked conversations no longer go unnoticed.
- Data Protection: Which protections are applied to the sensitive columns: Always Encrypted, dynamic data masking, row-level security, ledger tables and sensitivity classifications. Findings call out sensitive columns with no protection, disabled security policies, masked columns that users can still read through UNMASK, and column master keys held only in a Windows certificate store. Only metadata is read, never an encrypted or masked value.
Instance reports 3 reports, Database Health Monitor
- Analysis Services: The SQL Server Analysis Services instance beside a SQL Server, with its mode, version and properties, memory against its limits, how recently each database was processed, and its sessions and running commands. Everything is read only and nothing is processed or changed. Use Set SSAS Server on the toolbar when Analysis Services is not on the same host.
- Data Protection by Database: The Data Protection summary for every database on the instance, with the unprotected sensitive columns counted for each one.
- Service Broker by Database: Every database with Service Broker enabled, its queues, transmission queue rows and conversations, read one after another with progress and Cancel.
New features
9 items. The theme this release is putting health information in front of you without opening the application, making index changes safer, and collecting history faster.
Monitor service and tray
- Web dashboard. The monitoring service can serve a read-only web dashboard with an estate overview showing the worst servers first, a page for each server with 24 hour CPU, page life expectancy and batch requests charts, and pages for alerts, deadlocks and blocking. It is off by default and listens on localhost only until you change that on the tray’s new Web Dashboard tab. Access uses Windows authentication with Viewer and Admin groups, and the same data is available as JSON.
Indexing
- Index Consolidation Plan (Real Time, Indexing). Weighs a database’s existing indexes and its missing index suggestions together, table by table, to find the smallest set of changes: exact duplicates dropped, narrower indexes merged into wider ones, missing indexes folded into existing ones and unused indexes removed. Anything that backs a primary key, unique constraint or foreign key, or that is named in an index hint or a forced Query Store plan, is blocked. It writes one ordered script with a matching rollback, and the script stops if an index changed after the plan was read.
Connections
- Trust an untrusted certificate. When a saved connection is refused because the server certificate is not trusted, the application now asks once per session whether to trust it, saves the change, reconnects and opens the Server Overview, instead of only showing Disconnected.
- Missing SqlClient native DLL. The service, tray and other executables now say which SNI native DLL is missing instead of filing a crash report for every connection.
History collection and upgrade
- Faster history collection. The procedures that collect table growth, chargeback usage, file size, index usage and deadlock history were tuned to run faster.
- More forgiving history upgrade. Alert steps run correctly when the login is db_owner but not dbo, the upgrade stops once instead of repeatedly on Amazon RDS when the login is not the master user, and a history version that cannot be read now says why.
Replication
- Merge replication resolver health check, and a reorganized replication instance report.
Quick Scan and Azure SQL Health Monitor
- Quick Scan can be zoomed. Ctrl and the mouse wheel enlarge or shrink the description and affected objects text in the detail pane, and the size is kept for the session.
- Azure SQL Health Monitor offers Try Again and F5 after a report fails to open.
Bug fixes
278 tickets fixed, including 9 crashes and 30 fixes in Azure SQL Health Monitor. Most of the rest are wrong or misleading results, reports that stayed blank or claimed success after a query timeout, leaked connections, and grids that did not fit the window at 1280×900. Several of these bug fixes were around overall performance improvements and reducing CPU on the DBHealthHistory database.
September 2026 Release – Version 4.1625 Release
Twenty-nine new reports covering hardware, licensing, memory, security and cost, twelve new alerts plus alerts you write yourself, a redesigned performance dashboard, sensitive data discovery, and more than nine hundred fixes.
- 29 New reports
- 30 New features
- 934 Bug fixes
New reports
29 pages. Ten new database pages and seventeen new instance reports in Database Health Monitor, a Consolidation Planner on the Tools menu, and a Security Posture report in Azure SQL Health Monitor. Several of them come with a new history collection, so they can show trends and not only the current moment.
Database pages 10 reports, Database Health Monitor
- CDC and Change Tracking: Whether change data capture and change tracking are keeping up, with capture latency, errors, cleanup, retention, side table sizes and their effect on log reuse.
- Data Compression: Which tables and indexes would shrink with ROW, PAGE or columnstore archive compression, with the estimated savings weighed against how often each one is updated.
- Full-Text Search: The health of each full-text catalog, with population status, crawl errors, fragments and how fresh each full-text index is.
- In-Memory OLTP: What the memory-optimized tables hold, whether each hash index has the buckets its keys need, the checkpoint files, and which resource pool the database is bound to.
- Module Execution Statistics: Stored procedures, triggers and scalar functions in the plan cache ranked by CPU, duration, reads, writes and executions, so an expensive trigger can finally be found.
- Plan Guides and Hints: Every plan guide and whether it still validates, alongside Query Store hints, forced plans and the hints written into the code.
- Sensitive Data: Finds the columns likely to hold personal or payment data by name and, when you opt in, by sampling values, then applies SQL Server sensitivity classifications from a preview script. Sampled values are never stored, shown or logged.
- Table Growth History: Rows and size of each table over time, the fastest growing tables, and a size forecast, from a new daily table size collection.
- Temporal Tables: How big each history table is and how fast it grows, the retention policy, period gaps, indexing and whether cleanup is running.
- Version Store and ADR: How big the persistent version store and the database’s share of the tempdb version store are, and which session or transaction keeps them from being cleaned up.
Instance reports 17 reports, Database Health Monitor
- Availability SLA: Monthly uptime percent, outages, restarts and unreachable windows for each instance, from a new availability collection in the monitoring service.
- Chargeback: Each database’s share of CPU, I/O, storage and memory per month, priced with cost rates you set, from a new hourly usage collection.
- Connections Over Time: How many connections the instance had over a period you choose, and when the spikes happened.
- Failover Cluster: The nodes of a failover cluster instance, the current owner, quorum, shared disks and failover history.
- Host and Hardware: Sockets, cores, NUMA layout, virtual machine, operating system, power plan, lock pages in memory, instant file initialization and memory settings on one page.
- In-Memory OLTP by Database: In-Memory OLTP memory per database across the instance, with each database’s resource pool binding.
- Key Exhaustion by Database: The identity columns and sequences closest to their maximum value across every database on the instance.
- Latches and Spinlocks: Sampled latch and spinlock deltas, the top classes over the sample, and guidance for each latch class.
- License and Edition Footprint: Cores, edition, the Enterprise features actually in use, whether a downgrade to Standard is possible, and an estate cost view.
- Memory Pressure: Ring buffer pressure events, memory clerk history, NUMA node memory and page life expectancy per node, with a Last 7 days tab from a new history collection.
- Module Execution Statistics by Database: The busiest procedures, triggers and functions from every database, ranked together.
- Permissions Matrix: Every login mapped to every database, with its roles, explicit grants and denies, and the access that carries risk.
- Sensitive Data by Database: Classified and suggested sensitive columns for every database, with payment card and SSN column counts, TDE state and a Scan All Databases button.
- Session Waits: Each session’s wait profile and its open cursors, for troubleshooting while the problem is happening.
- Version Store and ADR by Database: Version store size for every database on the instance, and what is holding each one.
- Windows Event Log: SQL Server related System and Application events, including disk, cluster and memory errors.
- Workload by Application: CPU, reads, writes and sessions per program, host and login, with a Last 7 days tab from a new history collection.
Tools
- Consolidation Planner (Tools menu): Stacks the historic CPU, memory, storage and I/O of several instances onto target hardware to show whether they would fit together.
Azure SQL Health Monitor 1 report
- Security Posture: Firewall rules, Microsoft Entra admins, auditing, TDE, Microsoft Defender and permissions for an Azure SQL database on one page.
New features
30 items. The theme this release is hearing about problems sooner, with more alerts and more history, and making the product calmer to use when something goes wrong.
Alerts and history
- Twelve new built-in alerts. Failed Agent jobs, Agent jobs running long, an availability group replica that is not healthy, a changed synchronization state, a high send or redo queue, deadlocks, 823, 824 and 825 I/O errors, high severity errors, a SQL Server restart, SQL Agent not running, log percent full and TempDB space.
- Custom T-SQL alerts. Write your own check in T-SQL and have it alert like the built-in ones, and a copy of a built-in alert now keeps its own thresholds and exclusions.
- New history collections. Memory pressure, workload by application, daily table sizes, hourly chargeback usage, instance availability and identity and sequence values are now collected into DBHealthHistory, which feeds the new 7 day tabs and the projected exhaustion dates on Key Exhaustion.
- The history database repairs itself. Tables dropped from DBHealthHistory are recreated during the upgrade, with a warning naming them, instead of the upgrade getting stuck and every report that reads them failing.
- Quick Scan and the 24/7 monitoring run faster.
Everyday use
- Redesigned main performance dashboard. The start page has been rebuilt around a new set of performance cards.
- Save as Excel. Grids that could be saved as CSV can now also be saved as an Excel workbook, from the right click menu or Export This Page.
- Find, filter and sort on the remaining plain lists. Deadlock Advisor, Needs Parameters Advisor, Connect to Multiple Servers and the Technical Debt object viewer now have the find bar, column filters, sorting, row count and export of the other grids.
- Plain English error messages. Common SQL Server errors such as permission denied, timeouts, deadlocks, a read only database or a full log are shown as a short sentence saying what to do, with the original text still available in Copy details.
- A friendlier crash dialog. An unexpected error shows a plain summary first with the technical detail behind Show details and a Copy details button, and every unhandled error is written to a local crash log.
- Fewer interruptions. Blocking message boxes have been replaced with toast notifications, confirmation dialogs use the same wording throughout, and the old Thanks for Using reminder is gone.
- The Settings dialog checks values as they are typed and says what is wrong, instead of silently changing a bad index, CHECKDB, backup or retention value on OK.
- PageWalker and Performance Viewer remember their window size and position, and Log Reader asks for its backup file in one labeled dialog instead of two prompts.
Connections
- Safe server removal. Removing a server from the list asks first and offers Undo for the rest of the session.
- Registered Servers round trip. Export and import through SSMS Registered Servers now keep each server’s alias and server type, and a bulk import tests credentials in the background with a Skip remaining option.
- DR has been added to the list of server types.
Reports
- Key Exhaustion replaces Identity Column Usage. The page now covers sequences as well as identity columns, and shows a projected exhaustion date from the collected growth history.
- Backup Status has a Last Diff column showing the most recent differential backup.
- The Query Store reports are hidden for the model database.
Quick Scan
- Three new checks. @@SERVERNAME is NULL or empty, a linked server points back at the instance it is defined on, and @@SERVERNAME does not match the actual server name.
- Ola Hallengren’s maintenance solution is no longer bundled. Quick Scan points to Ola’s site so the latest version is always the one installed.
Tray and service
- Notification settings. The tray’s Settings tab turns balloon notifications on or off and sets the repeat interval, with the value checked as it is typed.
- Snooze notifications. A Snooze Notifications menu silences balloons for 15 minutes, 1 hour, 4 hours, until 8:00 AM or until turned back on, and survives a restart.
- Health you can read without color. The tray icon states now differ in shape and symbol as well as color.
- Balloon clicks open History filtered to the server, procedure and status the balloon was about.
- Nothing goes quiet. Notifications held back by the repeat interval are counted and reported, and a failed poll or settings reload is shown instead of being ignored.
- The Windows service writes a startup and lifecycle log and reports a failed start to the Application event log, naming the step that failed.
Safer tools
- Schema Drift asks before it pushes a CREATE or ALTER to a live database, showing the target server, database and exact SQL, and reports a failed results email instead of failing silently.
- Space Recovery asks before Do it now runs, and a run that fails or is stopped partway ends with a summary of what completed and a follow-up script holding only the statements that did not.
- Decryptionator’s buttons and DROP guard checkbox say more clearly what they do.
Bug fixes
934 tickets fixed, including 48 crashes and 42 fixes in Azure SQL Health Monitor. Most of the rest are wrong or misleading results, reports that crashed or went blank on a query timeout instead of saying so, leaked connections and drawing resources, and grids and charts that did not fit the window at 1280×900 or in split view.
September 2026 Release – Version 4.1540 Release
Sixty-three new reports, a server type on every connection, exporting and remembered window layouts, a tray icon that reports on the service, and more than five hundred fixes across crashes, wrong answers and pages that did not fit the window.
- 63 New reports
- 25 New features
- 515 Bug fixes
New reports
63 pages. Twenty-five Query Store reports and fifteen SSRS reports in Database Health Monitor, plus twenty-three more plan, workload, capacity and storage pages in Azure SQL Health Monitor.
Query Store suite 25 reports, Database Health Monitor
- Query Store Health: Whether Query Store is still collecting, and whether the history it claims to hold is really there.
- Automatic Tuning: The plan regressions SQL Server found on its own, and whether it was allowed to force the earlier plan back.
- Batch Mode Candidates: Which busy queries are still running one row at a time, and what batch mode would be worth.
- Change Significance: Whether a query’s change in duration or CPU is larger than its own run to run variation could produce.
- Cost Drift: Whether each busy query still costs what it used to per execution, and when that changed.
- Deployment Impact: What each procedure, function and trigger cost before and after its own change.
- Duration Spread: Which queries have a worst case that is pulling away from their typical case.
- Hourly Drift: Which hour of the day is getting heavier or slower than that same hour used to be.
- Key Lookups: Which indexes send the busiest plans back to the table, which columns they went back for, and what a covering index would remove.
- Latency Service Levels: Whether queries finish within a target you choose, and which ones miss it most often.
- Load Sensitivity: Which queries are only slow when the database is busy, and which are slow on their own.
- Parameter Sensitive Plans: Whether each statement SQL Server 2022 split by parameter value has a split that changed anything.
- Performance Baselines: Which queries have recent readings that break limits drawn from their own earlier history.
- Plan Differences: What is actually different inside the two plans a statement has been running, operator against operator.
- Plan Resource Profile: Two plans for one statement, measured on the eight resources Query Store keeps.
- Plan Survival: How long a plan lasts before the optimizer replaces it, and which queries change plans most often.
- Query Feedback: Every correction SQL Server 2022 has made to a plan on its own, and the ones it tried and took back.
- Rank Movement: Which queries are climbing toward the top of the ranking before anybody complains about them.
- Residual Predicates: Which seeks and scans read rows only to throw them away, and where in the key the column that does the throwing away should sit.
- Session SET Options: Which statements were compiled more than once because callers connected with different SET options.
- Slow Periods: When the database ran slower than usual, and which queries brought work with them or were only held up.
- Statement Hot Spots: Which statements inside a busy procedure, function or trigger run far more often than the module around them, which is what a loop looks like.
- Throughput and Latency Headroom: What an execution costs at each level of load, and where the cost passes twice the quiet baseline.
- Timeouts and Failed Executions: The executions that were aborted by the client or ended in an error, and the time they threw away.
- Workload Change: What changed between two windows of the same length, one query at a time.
SSRS suite 15 reports, Database Health Monitor
- SSRS Caching and Execution: How every report on a report server is set to execute, and which slow, busy reports are not cached.
- SSRS Catalog Inventory: Everything published to a report server, who published it, and how much of the catalog each item accounts for.
- SSRS Data Sources: How each data source gets its credentials, and which ones will break a subscription because they cannot supply credentials unattended.
- SSRS Delivery History: Which subscriptions fail to deliver, and the message each attempt left.
- SSRS Delivery Queue: What the report server is doing right now, and what has waited long enough to be called stuck.
- SSRS Failed Executions: Every report and status pairing that did not end in success, including runs that failed while nobody was watching.
- SSRS Never Run: The reports, shared data sources, shared datasets and empty folders that nothing has used within the execution log’s retention window.
- SSRS Permissions: Every role assignment, the items that break inheritance from their folder, and the users who no longer have access to anything.
- SSRS Report Parameters: Every report’s parameters in one grid, and the reports that cannot be scheduled because a required parameter has no default.
- SSRS Schedules: Which schedules drive nothing, have expired or have stopped moving forward, and whether the Agent job behind each one is enabled.
- SSRS Server Configuration: Every setting the report server keeps, compared against its shipped default.
- SSRS Shared Datasets: Which reports use each shared dataset, and which datasets nothing uses.
- SSRS Snapshots and History: What the stored renderings weigh, and which ones nothing points at or that have expired.
- SSRS What Fills This Database: What every table in the report server catalog and its temp database holds, in plain words.
- SSRS Subscriptions: Everything the report server sends out on its own, and which subscriptions have quietly stopped working, with enable, disable and delete scripts on the grid.
Azure SQL Health Monitor 23 reports
- Ascending Keys and Rows Past the Histogram: Which statistics have a histogram that stops before the data does, and what the optimizer guesses is out there instead.
- Backup Schedule and the Point-in-Time Restore Window: Which automated backups the platform took, whether the log backups kept their cadence, and how far back a restore can reach.
- Change Tracking and What Cleanup Leaves Behind: What change tracking keeps in its side tables, and whether the cleanup meant to bound them is running.
- Client Waits and Results Left Unread: How long statements waited for their clients to take the rows they had ready, and which applications are waiting right now.
- Commit Batching and What Each Log Flush Carries: How little each log flush carries against a 60 KB log block, and which statements commit a row at a time.
- Compute Accounting and the Work No Query Explains: How much of the processor time this database is charged for belongs to no statement Query Store recorded.
- Data File Space and What a Shrink Would Release: How much of each data file is allocated and unused, drawn as a map of the file.
- Elastic Pool Neighbors and Who Uses the Shared Allowance: Who in an elastic pool uses the room the pool is paid for, and whether they use it at the same time.
- In-Memory Tables and Hash Bucket Sizing: What the memory-optimized tables hold against the tier’s limit, and whether each hash index has the buckets its keys need.
- Latch Contention and the Structures Behind LATCH Waits: Which internal structure each latch wait protects, so that a LATCH_EX at the top of the list turns into a pattern with a name and a fix.
- Memory Allowance and What Holds It: Who holds the memory the service objective pays for, and how much the database could give back.
- Optimizer Search Depth and Plans Cut Short: How much work runs on plans whose search was ended early by a timeout or by running out of memory.
- Parameter Sensitive Plans and Whether Each Split Pays: Where the optimizer drew its boundaries, and whether a call either side of one really runs a different plan.
- Peak Load and the Queries That Size the Tier: Which statements the busiest stretch of the window is made of, and how much lower the peak would be without each of them.
- Performance Counter Ratios and the Rules of Thumb: The classic Performance Monitor ratios, measured over a live sample rather than averaged since startup.
- Query Store Hints and Whether Each Still Pays: Whether each Query Store hint is still applied, and what a call costs with the hint against without it.
- Replica Lag and What Commits Wait For: How far behind the primary each replica is, and how long writers were held back because a replica could not keep up.
- Resize History and What Each Change Bought: Every time the database changed size, and whether the change bought anything the work used.
- Resource Coupling and Which Limits Rise Together: Which governed resources are busy at the same moments, which take turns, and which is busy on its own.
- CPU Run Queue and Who Waits for a Processor: How deep the queues behind the schedulers ran, and which statements are standing in them.
- Serverless Billing and What Keeps the Meter Running: What the serverless tier bills for, stretch by stretch, and which of the three billing rules was on top.
- Temporal History and What Versioning Keeps: How much history each system-versioned table keeps against the table itself, and whether a retention is holding it.
- Workload Groups and What the Platform Runs Beside You: Who spent the CPU, reads, writes and log of the SQL instance: your queries, another database’s, or the platform’s own work.
New features
25 items. The theme this release is knowing which server you are looking at, moving results out of the product, and keeping backup and restore scripts right.
Connections and servers
- Server types. Tag each connection Production, Test and so on. The type shows as a color chip in the server tree and can be used to sort and filter. When a new connection is hidden by the current type filter, the product now offers to show all types.
- Edit Connection. Change a saved connection in place instead of removing it and adding it again.
- License and instance limit state. The license state is shown in a dismissible strip, servers past the instance limit are no longer dropped silently, and the registration dialog gives a message per field.
- Settings shared between programs. A running program re-reads the settings file when another copy has saved it, so an instance added by a second copy is listed without a restart. Saves are atomic and wait out a busy file.
Everyday use
- Export to files. Grids, charts and pages can be exported as CSV, HTML and PNG.
- Remembered layout. The main window position and size, the navigation tree width and the column layout of the key report grids are remembered between sessions.
- One time window control. The same time window control now appears on the reports that have one, with a global default.
- Find and shortcuts. Grids have a find bar (Ctrl+F) and a row count, a Keyboard Shortcuts list shows the keys, and the shell controls have accessible names.
- Live panels say when they last updated, reconnect and retry by themselves, and stop querying while the window is minimized.
- Fragmented Index Advisor shows elapsed time and progress, can be stopped, refuses a second start and warns before it is closed mid run.
- Main window minimum size can no longer be larger than the screen it is on, and the window size is shown while it is being resized.
- Guide Me tour. Bug fixes and improvements to the guided track.
Backup and restore
- Copy the full restore sequence. Backup Status copies the complete restore sequence with every file name.
- Striped backups. Backup Advisor restores a striped backup with one RESTORE rather than one per stripe, and Backup Size and Backup Time Frames list a striped or mirrored backup once.
- MOVE options. Backup Advisor takes new file locations and writes the MOVE clauses for them.
- Backup Time Frames opens the Backup Advisor for a backup, with the original restore script.
- Log Viewer lists the log backups of the selected database.
- Backup Status is faster on instances with a large backup history.
- Log shipping settings. The Log Shipping report can change the settings of a chain that do not need log shipping set up again, and a right click shows the backup or restore history for the database. The Stedman log shipping procedures are now distributed in the DBHealthHistory database.
Quick Scan
- New checks. Warn when the instance backup checksum default is not 1, when Query Store is not enabled, and offer to schedule the Ola Hallengren jobs from check 238. The outdated build check now knows SQL Server 2025.
Reports and tools
- Download report and package definitions. A right click on the SSRS pages downloads the RDL, RSD and RDS files, and a right click on the SSIS grids downloads the DTSX package.
- Tray icon shows service health, and notifies when monitoring fails or SQL Server is restarted automatically.
- Decryptionator lists, reads and decrypts database DDL triggers.
- Historic rebuild reports what went wrong. An error during a history rebuild is now reported with its detail, and repeated upgrade steps are skipped when there is nothing to do.
- Obsolete projects removed. The Express scheduler and the component tester are no longer part of the solution.
Bug fixes
515 tickets fixed. Most of this release is behavior that was quietly wrong: a page measuring time on the wrong clock, a script that would not run on a name with a bracket in it, a grid whose verdict column sat off the edge of the window. The entries below group the tickets by what went wrong.
Crashes and exceptions
- Failures that are the server’s answer no longer file crash reports. A rejected login, a TLS or SSL handshake failure, a toast with no window, a redraw on an instance with no main form, and the Rewards page when the licensing service cannot be reached were all reported as crashes.
- Starting without an interactive session no longer files a crash report from the splash screen, and Azure SQL Health Monitor no longer exits at startup in that case. Test scripts hosting the assemblies no longer file crash reports either.
- DataCache threw a missing key error when two workers expired the same entry, and could spin forever when two threads added the same key. The startup license check also threw inside its own Catch.
- Job History, Connections by Database and the instance reports menu threw NullReferenceException or left a reader open on the shared connection.
- Navigating between pages leaked Labels and window handles until the process failed with “Error creating window handle”.
- Right click on a report grid threw OverflowException in the 64 bit build when the screen position was negative, and several tool menu items threw ArgumentOutOfRangeException.
- Quick Scan Deep Scan crashed when a check timed out, and threw “Collection was modified” when a lane was still reading at the timeout. Cardinality Report crashed when a count timed out, and divided by zero on a table without columns.
- Ignore Waits, Technical Debt settings, Backup Size, Historic Waits and Historic Version crashes on a blank or missing value, a double click on empty space, or an empty result.
- A settings value holding an unpaired surrogate or a control character made every later save fail.
Silent failures and misleading results
- Quick Scan fixes and the license key dialog reported success when the change had failed. Quick Scan fix dialogs now report the failure, and entering a license key no longer closes the dialog when the key could not be written.
- A connection added, edited, removed or imported was lost silently when connections.xml could not be written, and a connection list that could not be read was overwritten.
- Email alerts. The queue no longer sends a message without its attachments when they could not be read, and never re-sends a message the SMTP server already accepted.
- Update All Historic Databases reported an unreachable or stuck history database as checked and up to date.
- Overview panels kept re-running a query the login could not run. They now stop and say the login lacks VIEW SERVER STATE, and show “not read” rather than a verdict when a read fails.
- Query Store Health reported a healthy store as empty or stopped when a read timed out.
- Query Loading Ramp headless mode ran zero queries and exited 0 when given a parameter file with no data rows.
- Download latest version did nothing when the installer zip was unreadable.
Wrong answers
- Time measured on the wrong clock. Ages, uptime, recency and windows were measured on the workstation clock instead of the server’s on the Index reports, Connections pages, Msdb reports, SSRS and SSIS pages, Error Log, Server Overview, Memory Ladder, CPU and IO by Query, Missing Index and the Event Studio, Log Reader and PageWalker tools.
- Dates and regional settings. Historic queries and generated scripts now send dates in the invariant culture, Job History and the msdb purge scripts use yyyyMMdd, and Growth Trend, Rank Movement and several pages cut days in the reader’s local time zone. Pages no longer break under a non-colon time separator or a non-English SQL login language.
- Units and arithmetic. Total Memory converted KB to GB with 1000, IO by Hour hover text overstated IO by 1024, Log Viewer always showed a compression ratio of 100, and several time formatters mis-rounded minutes and sub-second values.
- Backup and restore answers. Restore plans over-counted log backups when a differential applies, judged restorability from the newest full rather than the base full, and took the file check from a COPY_ONLY full. Backup Size dropped COPY_ONLY backups, Backup Time Frames drew a backup that crossed midnight from the far left edge, and Growth from Backups and Backup Speed mixed in backups restored here from another server.
- Corruption Response Kit. Point in time scripts no longer restore a differential that finished after the stop time or apply log backups taken before the differential, heap salvage finds the heap’s pages, and salvage scripts work on identity and rowversion tables.
- Index reports. Duplicate and Unused Indexes now compare the sort direction of each key column and no longer pick a disabled index as the keeper. Index Review, Problem Indexes, Large Tables and Index Fragmentation also had wrong counts, wrong fill factors or one row per partition.
- Quick Scan scoring. Checks that could not run are left out of the score, the SQL Express file limit checks use the version dependent limit and add up data files only, Huge Error Log can now fire, and several checks reported the wrong row count, the wrong check number or failed on unusual database names.
- Query Store pages. Plan Survival no longer reports “Forces not holding” for a forced plan that is current, Workload Change compares windows holding the same number of complete intervals, Rank Movement no longer marks every quiet period as partial, Deployment Impact and Schema Changes count only the Query Store time they were measured over, and Plan Differences names a change that is only a plan warning.
- Deadlocks, blocking and sessions. Multi-cycle deadlock reports labeled every victim after the first as Winner, the blocking heat map scaled by percent_rank so a five second blip looked like a peak, Active Blocking missed cycles and chains headed by an unseen session, and grids with two requests or two transactions in one session showed one of them twice.
- Historic Waits charts added an extra day, or dropped the last day, at several zoom levels, and the Year zoom scrolled by the wrong interval.
- Technical Debt counted matches with LEN instead of DATALENGTH, skipped several checks and dropped the last line of each syscomments row.
Generated scripts
- Names with a bracket or an apostrophe. Generated and executed scripts across Schema Drift, Problem Indexes, Columnstore, Partitioning, Quick Scan, VLF Advisor, Decryptionator and the report queries now double a closing bracket, quote with QUOTENAME and pass names as parameters instead of splicing them into T-SQL.
- Rebuild and undo scripts. LOB Columns rebuild scripts carry the index’s own options and write ON [scheme]([column]) for a partitioned index, the Space Recovery VLF script rebuilds every log file, the clustering key script keeps DESC, and the foreign key health script writes one CREATE INDEX per distinct column list.
- Log Reader undo scripts for a table with no primary key, and for a modify on computed, rowversion or dropped columns, now produce statements that run.
- Data Compare. The sync script only re-enables triggers that were enabled, large text columns are no longer reported as changed when only DATALENGTH differs, float values compare exactly, and a DELETE is no longer scripted for a row whose large value could not be read in full.
- Schema Drift. CREATE OR ALTER no longer becomes an invalid ALTER OR ALTER, UNIQUE constraints compare as their own object type, permission, table, key and contract scripts carry the attributes that change behavior, and same named objects in different schemas are no longer merged.
Layout, scaling and drawing
- More than 150 grids, charts, footers and dialogs had a column, caption or button pushed off the edge at 1280×900, 1600×900 or 125 to 150 percent scaling. The verdict or advice column of the SSIS, SSRS, Query Store, msdb and index pages is now on screen without scrolling sideways.
- Charts and panels that vanished or were painted over when the detail pane, the ad or the assistant narrowed the page, including Security Posture, Quick Scan, Deadlock and Failed Jobs lanes, and the Replication toolbar.
- Drawing leaks. Dozens of chart controls, TimeGraph, EnhancedListView and several panels created fonts, bitmaps, brushes and tooltips on every redraw or resize and never released them.
Connections, settings and history
- Settings and connection saves. The settings file saves atomically, serializes access between processes and no longer overwrites a change another program made. The recent servers list is saved bar separated, so a server written with a port is no longer split.
- Connect strings quote the database name, and the Connect dialog no longer quotes a SQL authentication password twice.
- Historic monitoring. Retention days of 0 now means keep forever, alert procedures handle white space in the ignore list, index usage tracking copes with databases in a restoring state, and the Tray history honors escaped pipes so long messages display correctly.
- Tray passwords. SMTP and server passwords saved by the Tray are now readable by the LocalSystem service.
Azure SQL Health Monitor
- Microsoft Entra sign in. The Tenant ID is now applied to service principal, interactive and device code sign in, and a device code with a blank Tenant ID shows the user code.
- Retries and reloads. A statement that timed out or was already sent is no longer repeated, a reload during the first load of a page is ignored, and a typed password is kept only after it worked.
- Wrong verdicts. Replication waits were counted as throttling, the throttling verdict tested only the top eight waits, Top Queries memory ranked a sum of peaks, and the Plan Regressions verdict said plans did not change when other rows did.
- Connections. Import stops at the license database limit, Edit Connection reloads the open page, Back returns to the report you came from, and duplicate connections are refused.
September 2026 Release – Version 4.1517 Release
Ninety new reports, a drill-through navigation layer that connects them, actions that carry a fix from one instance to the rest of the estate, and a large pass over silent failures.
- 90 New reports
- 38 New features
- 47 Bug fixes
- 45 New chart shapes
New reports
90 pages. Three new report suites in Database Health Monitor cover the two system databases and the SSIS catalog that nothing in the product read before, plus thirty-one new plan, workload and resource pages in Azure SQL Health Monitor.
msdb suite 22 reports, Database Health Monitor
- Agent Activity: Is SQL Server Agent up, how long has it been up, and what is running right now. Filtered to the current Agent session, so a job left running by a service restart is not reported as running today.
- Agent Security: Who owns the automation on this instance, and who can run it.
- Agent Settings: How Agent itself is configured, and what that is doing to msdb.
- Alerts and Operators: If something breaks tonight, does anyone hear about it.
- Backup Ledger: Whether the record of the backups is itself complete, honest and maintainable.
- Backup Speed: How fast each backup runs, and whether that is changing.
- Data Collector: Whether the collector is running, and what it has been failing to upload.
- Growth from Backups How big each database was, going back as far as msdb does.
- Job Commands Every line of T-SQL, command line and script the Agent jobs run, in one place.
- Job Step Failures: Which step of which job fails, and what it actually says.
- Missed Runs: What was supposed to run and did not.
- Subsystem Load: Whether Agent can actually run everything that is scheduled at once.
- Maintenance Plans: What the plans do, and what they said the last time they ran.
- Database Mail Setup: Who can send mail from this instance, through which server, and what is configured.
- Database Mail History: What this instance has tried to send, what happened to it, and how long it took.
- Mail Content: What this instance is actually putting in the post.
- Mail Recipients: Who is on the receiving end of this instance.
- Restore History: What has been restored onto this instance, when, from where, and by whom.
- msdb Space and Retention: What is filling msdb, how far back it goes, and what trims it.
- Package Store: The SSIS and DTS packages stored inside msdb itself.
- Policy Evaluation: Whether Policy Based Management is doing anything here, and what it found.
- Third Party Objects: What somebody else installed into msdb.
master suite 16 reports, Database Health Monitor
- master Overview: What is in master on this instance, one line per page, and a way into each of them.
- master Backup and Rebuild Readiness: If this server were gone tomorrow, how much of what is in master could be put back.
- master Change Ledger: What has changed at server level on this instance, in one list, in order.
- master Server Permissions: Who holds server level rights that no fixed role gave them.
- master Server Triggers: Code that runs on every login or every DDL statement on this instance.
- master Startup Procedures: What runs before anybody connects, and what somebody set as a startup parameter.
- master Service Facts: What account this instance runs as, how it starts, and whether it has ever been changed.
- master Endpoints: What can connect to this instance, over what, on which port, and who is allowed.
- master Credentials: Which outside identities this instance holds, and what uses each one.
- master Keys and Certificates: What master is protecting, and whether any of it has ever been backed up.
- master Server Audits: Whether auditing is on, whether it is actually writing, and what it would catch.
- master Resource Governor: Whether anything on this instance is being capped, and whether the cap is being reached.
- master Database Properties: Which databases on this instance are set up differently from all the others.
- master File Map: Every file of every database on this instance, including the databases nobody looks at.
- master Footprint: How big master is, where it lives, and whether that size is normal.
- master User Objects: What somebody installed in master, when, and what happens to it when this server is rebuilt.
SSIS catalog suite 20 reports, Database Health Monitor
- SSIS Catalog Inventory: What is deployed here, who deployed it, when, and what has never run.
- SSIS Catalog Health: Why SSISDB is the largest database on the instance, and whether its own maintenance runs.
- SSIS Who Fills It: One package is writing most of this database. Which one?
- SSIS Packages Run: What ran, when, and how it ended.
- SSIS Running Now: What is executing at this moment, and what has been claiming to execute since a restart.
- SSIS Package Failures: What failed, how often, and with what message.
- SSIS Reruns and Retries: Which packages only work on the second go.
- SSIS Package Speed: Is this run slow, or is this package always like that?
- SSIS Batch Critical Path: The night ends at 05:12, and which package made it so.
- SSIS Batch Completion Trend: What time the overnight batch actually finishes, and whether that is moving.
- SSIS Schedule and Concurrency: What runs when, what runs at the same time as what, and what was never scheduled.
- SSIS Self Contention: Is this package slow because it is slow, or because of what runs beside it?
- SSIS Inside the Package: Which task inside the package burned the time, and how many times it ran.
- SSIS Data Flow: How many rows actually moved, along which path, and which component held the line up.
- SSIS Child Package Map: Which packages call which, derived from what actually ran.
- SSIS Connection Reach: What this catalog talks to, and what breaks if it goes away.
- SSIS Environments and Parameters: Which environment supplies what, and which parameter nothing supplies.
- SSIS Run Time Overrides: Which runs were started with something changed, and what.
- SSIS Job and Package Disagreement: Which Agent jobs report success on a night the package failed.
- SSIS Dumps and Legacy Runtime: Two columns every execution carries and no report read.
Instance level Database Health Monitor
- Bottleneck Mix by Database. What kind of problem each database, or each expensive query across the instance, has before anybody decides what to do about it. Every other query page ranks by cost; this one throws the amount out of the position and places each subject in a ternary triangle by how it divides its effort between processor, storage and contention. Databases that are offline, restoring or unreadable by the connected login are named rather than silently dropped, and so is a database with Query Store or wait capture switched off.
- Deprecated Features, rebuilt as a report class. The old XML grid report is replaced. Descriptions now come from a knowledge table rather than a 267-branch CASE inside the XML, the counts carry a per-day rate against instance uptime instead of a raw cumulative counter, the counters are sampled twice so the page can say whether a feature is still being used right now, and a new locator layer says where each deprecated feature is being used instead of leaving the reader with an instance-wide number and nowhere to go. Statements issued by Database Health Monitor’s own collector are marked as such.
Azure SQL Health Monitor 31 reports
- Missing Index Consolidation: The missing index requests on each table, folded into the fewest indexes that answer all of them, with create / widen in place / already covered decided per index.
- Key Lookups and Covering Index Candidates: Which indexes send the busiest plans back to the table, which columns they went back for, and where adding columns stops paying for itself.
- Statistics Behind the Busiest Plans: Which statistics the busiest plans were compiled against, the condition each is in now, and how much of the badly misestimated work depends on it.
- Plan Survival and How Long Plans Last: How long a plan lasts before the optimizer replaces it, drawn as a survival curve that keeps the plans not yet replaced.
- Plan Differences and What Changed Inside: What is actually different inside the two plans a statement has been running, operator against operator.
- Plan Resource Profiles: Two plans for one statement, measured on all eight resources Query Store keeps.
- Estimate Cascade: Where inside a plan the row count stopped being measured and started being guessed.
- Residual Predicates and Key Column Order: Which seeks and scans read rows only to throw them away, and which column order would stop it.
- Live Query Progress and Estimate Overruns: How far through its plan every long running query is, and which operator it is working in.
- Batch Mode and Columnstore Candidates: Which busy queries are still running one row at a time, and what batch mode would be worth.
- Cost Drift: Whether each busy statement still costs what it used to per execution, and when that changed.
- Work Scaling and the Break-Even Between Plans: What one execution costs, priced against how much it was asked to do.
- Row Width and How Many Fit on a Page: How wide each table’s rows are, and how many the storage engine can fit on a page.
- Segment Elimination and the Order of the Data: How much of a columnstore index a query has to read, decided by the order the rows arrived in.
- Session SET Options and Split Compilations: The settings the workload arrived with, and the statements compiled more than once because callers disagreed.
- Concurrency Footprint and the Worker Allowance: How much of the concurrency allowance each query holds, and how much was held at once.
- Lock Footprint and Escalation Risk: What each transaction has under lock right now, and how close it is to escalation.
- Parallel Thread Skew and Idle Workers: Which parallel queries handed nearly all their work to one worker, and which operator did it.
- Waits by Application, Host and Login: Which application, host and login is doing the waiting, and what each is waiting on.
- Storage Latency and What Waits for It: How long one read and one write actually take on this database’s files.
- Transaction Log Space and What Holds Truncation: How much of the log is in use, which part cannot be released, and what is holding it.
- Resource Rooflines: Which of the service objective’s two allowances is the one standing in front of each query.
- Service Tier Fit and What Stops You Resizing: Which sizes this database could be on would have carried the workload it already ran.
- Burst Load and What the Averages Hide: How long each governed resource sat at the ceiling, and how much a five minute average hides.
- Load Hysteresis and Recovery Lag: Whether a query gets slow when the database gets busy, or stays slow for hours after.
- Slow Periods and What Runs In Them: The hours this database was slower than usual, and which queries were heavy in exactly those hours.
- Workload Regimes and When the Mix Changed: Whether this database has been doing the same thing all window, and if not, when it stopped.
- Workload Shifts: Which time of day each query does its work, and how wide a window it lands in.
- Workload Turnover: How much of what runs now is code that did not exist when the window opened, and what it costs.
- Maintenance Windows and the Quiet Hours: Where in the cycle there is a stretch long enough for heavy work, and whether it is quiet every time.
- Read Offload and What Could Run on a Replica: How much of this database’s work never writes anything, and could run on a read replica.
New features
38 items. The theme this release is getting from a finding to the next step without leaving the product: a shared drill-through layer, actions that run the change, and a guided path for someone who knows the symptom but not the page.
Navigation and drill-through
- Drill-through navigation across the product. A shared catalog of drill targets and a typed focus token (database, table, index, query, session, job, login, drive, wait type) means a row on one page can open the page that explains it, already filtered to the thing the row named. Reached from a new Go to group on the right click menu.
- Right click menus on the reports that had none. A new list view base adds report-specific items to the right click menu without a second menu appearing on top of the built-in copy and filter items. Added to Backup Status, Database by Size, Failed Jobs, Job History, Large Tables, Logins, Memory Grants, TDE Status, Suspect Pages, Buffer Pool by Object, Index Contention, Table Use, Table Space Breakdown, Unused Indexes and others.
- Session follow-through on the live pages. Sessions, Connections, Open Transactions, Blocking Tree and What Is Active share one landing routine, so a session followed from one page lands the same way on the next, with reuse of a closed session’s id detected rather than reported as the same session.
- Error log entries lead somewhere. The classifier now reads the database, login and drive out of the fixed wording SQL Server uses, and offers them on the Go to menu. An entry that matches none of it offers nothing rather than a guess.
- Related links rebuilt. The related-links panel is driven from an expanded catalog rather than a hardcoded list, and is covered by its own tests.
- Ctrl+Left and Ctrl+Right walk one list. The two hand written Select Case chains behind the instance report arrows are replaced by a single ordered list, so both directions are read off the same order and a report cannot be reachable from one side only.
- Go Back history improvements across report, database and instance navigation.
Actions: running the fix, not just scripting it
- Run on other instances. A change that just succeeded on one instance can be run on the other connected instances, with a read-only check per instance first that says whether it already has the change. The three database loops now quote with QUOTENAME, and cost threshold counts as set at 50 or more so a server deliberately raised to 75 is left alone.
- DBCC CHECKDB queue. Runs CHECKDB over every overdue database on an instance, one database at a time, instead of opening the single-database dialog once per database.
- Agent job actions. Start, stop and enable a job from the Failed Jobs and Job History pages, with the pending-request state (asked to start, not yet begun) reported as itself rather than as running or idle.
- File growth advisor. Set a file’s autogrowth to a fixed size, or grow it now, from the Files and File Utilization menus. A grow that would leave a volume below its free-space floor is refused.
- Update Statistics window. Runs UPDATE STATISTICS for the rows selected on the Index Statistics report, rather than scripting a whole database of statistics.
- Log chain follow-up. After switching a database between SIMPLE and FULL on Backup Status, the page now says what is left undone: the log keeps clearing until a full backup is taken, and the Agent job steps that can no longer back up that log are listed.
- Quick Scan instance fixes moved into a shared module so the report and Run on other instances run the same statements.
- Open in SSMS. Opens SQL Server Management Studio on the instance the report is showing, in the database the row names, with the page’s script already loaded. A Settings tab finds the installed copies, or takes an explicit path.
Guidance and first run
- Guide Me. A guided track for someone who knows the symptom but not the page: a strip pinned to the right of the main window opens one page at a time and says what to look at on it. Tracks are defined in data, and progress is remembered.
- Rail help panel. Replaces the fixed help text box with a panel sized to what it holds, and replaces the Select Case in MainForm that knew about six timer modes with per-page help text for the whole product.
- Loading messages. A pool of lines shown while the product is waiting on a server, instead of a bare progress bar.
Historic monitoring
- Historic options dialog. One place for the history database settings that were previously spread across several dialogs.
- Historic database rebuild. A supervised rebuild of the history database with a per-step ledger (ok, skipped, failed), a confirmation that names what will be dropped, and a verification pass that reads back what the rebuild was supposed to leave behind. A rebuild that threw nothing is not assumed to have worked.
- Databases with history that are no longer on the instance are listed rather than left invisible.
Deadlocks
- Deadlock Advisor rebuilt. A new shredder reads the whole deadlock graph rather than stopping after the first lock, a classifier names the pattern, and a graph view draws the resources and the waits between them.
- T-SQL colouring. The two statements at the centre of a deadlock are now coloured T-SQL in a fixed-width font instead of bare text boxes in the dialog’s proportional font.
- Deadlock history and objects pages updated to the same shredder, so every deadlock page agrees about what a graph contains.
Interface
- Toast notifications. Non-blocking status messages in three levels, replacing message boxes raised off the UI thread for results that only need to be seen once.
- Themed confirmation dialogs. A shared confirm dialog with named buttons (“Delete 12 entries” / “Keep”) and question, warning and danger treatments, replacing MessageBox.Show Yes/No prompts across the alerting log, replication, Query Store enablement, and elsewhere.
- Every Designer dialog refitted onto one base class. One baseline font and scale, consistent padding and button order, and AcceptButton / CancelButton set so Enter and Esc always do something. Around 40 dialogs.
- Colour palette work. A rewritten colour helper with a chart palette that returns a distinct colour per series offset, tested against colour blind mode and greyscale.
- Index Review rebuilt. The single 1,450-line control is split into a model, grid, table view, script pane, theme and writers, with a new Missing Indexes page grouped by table: the table list on top with size, write volume and total benefit, and tabs beneath for suggested indexes with a CREATE INDEX script each, the table’s columns, and the indexes it already has.
- New chart shapes. Bottleneck ternary chart, deprecation Pareto, backup size trend, historic waits columns, msdb rank bars and time lanes, SSIS run lanes, rank bars and clock trend in Database Health Monitor; 31 new chart controls in Azure SQL Health Monitor, including survival curves, Hasse diagrams, bipartite plans-to-statistics plots, Mekko, roofline, orbit, Lorenz and phase dial.
Platform and packaging
- Optional encryption in the connect dialog. Two new choices, Optional and Optional, trust the server certificate, for servers that offer encryption but do not require it. Saved connection strings stay readable by older versions: the words written are only ones System.Data.SqlClient accepts, and the Optional keyword Microsoft.Data.SqlClient needs is added in memory as each connection opens.
- Crash reporting. Unhandled exceptions, unobserved task faults and background worker failures now reach the crash report endpoint with the full exception, its inner exceptions and the stack from the line that threw, deduplicated by exception type and throwing frame so one repainting bug does not file a report per frame. StedmanCore reports through a hook set by the application, so reports carry the application’s version rather than the library’s.
- MSChart is no longer redistributed. The remaining MSChart-based charts were rewritten on the product’s own drawing code, and the MSChart redistributable is removed from the installer.
- Licensing and update checks moved to the V4 web service in both Database Health Monitor and Azure SQL Health Monitor.
- SQL Server build numbers updated for 2017, 2019, 2022 and 2025.
- Settings dialog gains the SSMS path tab and additional options, with tab indexes preserved for callers that open a specific tab.
- Single-instance mode for support captures. Crash sweep and demo recording can be limited to one instance, so a settings file holding every server ever connected does not cost a connection attempt per server.
- Migrated to Microsoft.Data.SqlClient with the driver selectable, and NuGet package references refreshed across the solution.
Bug fixes
47 items. A large share of this release is failures that used to happen quietly: a worker that stopped with nothing written down, a page that drew an empty answer, a Catch that sent a bare message and lost the line that threw.
Crashes and exceptions
- Blocking Monitor threw on an empty interval box. The interval was parsed straight off the text box, and the box empties itself whenever its own parse fails, so pressing a letter and then Start Monitoring threw FormatException. A “0” parsed fine and then hit ArgumentException from the timer. Neither had a Catch anywhere on the path.
- Blocking Monitor threw ArgumentOutOfRangeException when opened before any instance had been connected.
- The server tree lookup threw a NullReferenceException whenever the instance was no longer in the tree, and again inside the Catch that was meant to handle it. It also left a flag set, which swallowed the user’s next click.
- Clicking during a tree rebuild threw. Tree loading pumps messages while it rebuilds, and a click that landed in that window threw.
- Historic Query Waits Advisor threw IndexOutOfRangeException past the last time slot.
- The server health report threw on an empty object name before the first test could be made, and threw into the outer Catch instead of skipping the object.
- Startup subtree loading threw for every offline instance on an implicit conversion of an empty value to Double.
- The AI panels’ background workers had no completion handler, so anything the worker threw was swallowed and the panel printed one sentence with no message, no log line and no report.
- Index LOB Columns and related pages replaced themselves with “The report being run appears to have crashed” because the database was not set before the page was built.
- Statistics and Table Size advisors reported faults from the UI thread, with a stack starting at the Catch rather than the line that threw, and without the exception type.
- Incremental Shrink advisor reported server messages and code faults through the same path, so a real fault was indistinguishable from a server response.
- Word automation failures are caught rather than taking the export down with them.
- Unobserved task exceptions are now trapped. .NET 4.8 drops them silently, so these failures previously left no trace at all.
Silent failures and empty pages
- The quiet auto-refresh path on the live pages threw the exception away. Sessions, Connections, Open Transactions, Blocking Tree and What Is Active each had a quiet reload that discarded any failure without writing anything, so a server that had gone away simply stopped updating. A connection failure inside a countdown threw with no message, no log line and no change on screen.
- The Database Overview worker stopped silently on a null read, so the page came back partly built with nothing said about why.
- A Catch on the Database Overview page returned early, which skipped hiding the progress bar and starting the refresh timer.
- An unmatched branch on the Database Overview page drew nothing, leaving the reader on the page they were already on with no indication anything had happened.
- The Technical Debt scan lost its worker’s error. The failure went into e.Error with nothing reading it, so there was no log entry and no rows.
- Technical Debt now counts and reports encrypted modules rather than skipping them silently.
- Quick Scan showed ex.Message in a message box and nothing else for each of its checks, not even a log line, so nothing was ever filed. Its Catch also appended “Historic monitoring must be enabled” to every failure regardless of cause.
- Instance Problem Indexes skipped the refresh timer because it constructed the report class directly.
- Menu items that could not resolve their target did nothing. They now open the picker with nothing bound, or log the reason, rather than silently ignoring the click.
- Report failures inside DatabaseHealthComponents were invisible to the crash reporter: a section that threw showed red text, and a worker that threw showed a status line, and neither was reported.
- A failure during a silent report run had nowhere to go and was discarded; it is now written down.
Wrong answers
- Deprecated Features printed blank descriptions for the rows that mattered most. The description CASE used the collapsed documentation label for compatibility level, so six counters on SQL Server 2019 and seven on 2022 came back NULL; Database Mirroring missed the same way. Twenty more branches matched no counter published by any supported version. The counts also had no denominator, so a count of 3 on a server up for 400 days and one up for ten minutes looked identical.
- The Failover Compatibility report drew an empty chart and a toolbar of dead controls on an instance that is in no availability group. It now says so in a message, and reads the replicas before building anything.
- The deadlock query threw away every lock after the first, and used four separate OUTER APPLY nodes() calls that could not be lined up with one another.
- Quick Scan instance fixes failed on database names containing ]. The names were bracketed by hand, so ALTER DATABASE failed to parse (Msg 156) and that database kept its setting while the rest changed.
- An inner join dropped endpoints with no TCP row, and dropped job history rows whose job had been deleted.
- A chart with more series than the palette had entries gave every series the same colour, because the palette ignored the offset it was passed and returned black.
- An SSIS query counting executions against seven days of job history reported three weeks of packages as if they were in the window.
- A time range derived from marks alone drew a single mark as the whole of time.
- A chart segment was found by walking the hit test downward, which arrived at the wrong column.
- A deprecation locator reported line 1 for every module that matched only the second alternative of the pattern.
- Databases the connected login cannot enter are reported as rows rather than failing the whole estate-wide scan, which is the failure that silently dropped one database out of a scan.
- A query using syntax added in SQL Server 2017 or 2022 would fail the batch at compile time on every older instance, which no TRY/CATCH can rescue.
- Large Tables opened the wrong drill target (expanding the table’s database instead of the Disk Space report for the instance).
- Job History opened the whole list instead of the job that was picked.
- The Waits Advisor was reachable only by double click.
Connections and history
- The historic upgrader failed on a clean database. A version step was missing, and the waits index script ran at a version some databases had already passed; the index creation moved to a later step and a duplicate index definition was removed.
- Testing the history connection could replace the application-wide shared connection with a failed one, and left a Pooling=false connection open from a previous run.
- Overview workers left a reader open on the shared connection, failing the next stage with a second-DataReader error when a load was cancelled early.
- Dropped and refused connection errors were reported as dropped connections regardless of cause, so a server refusing the query read the same as a network drop.
- A connection kept by one step was dropped by the next, leaving the page to reconnect for work it already had a connection for.
- The historic waits report is released when the history database is replaced, so its date range, drill path and filters do not describe rows that no longer exist.
- Historic monitoring alert and tracking procedures corrected for long running queries, blocking queries on both SQL 2016+ and older builds, CPU snapshots, and the DBCC CHECKDB alert.
September 2026 Release – Version 4.1501 Release
Database Health Monitor 4 is now available, representing a major overhaul rather than a visual refresh. Nearly every existing report has been rebuilt with improved queries, charts, verdicts, and drilldowns, while dozens of entirely new reports answer questions the previous version could not. To celebrate the release, all new users—and anyone whose previous trial expired—can use Version 4 free through October 31, 2026.
The redesigned interface includes full dark-mode support, more meaningful charts, plain-English findings, severity indicators, and one-click chart copying for tickets and emails. Performance has also improved through expanded background processing, with Schema Search now approximately three-and-a-half times faster. Registered servers can be imported and exported, making it easier to move Database Health Monitor to a new computer.
New reports include Blocking Tree, Recovery Exposure, Migration Planner, Security Posture, Optimized Locking, TempDB Metadata Contention, and Table Space Breakdown. Availability Groups, replication, log shipping, and linked-server reports have also been rebuilt to clearly show whether data is still moving and where problems exist. Version 4 is automatically tested across every supported release from SQL Server 2008 through SQL Server 2025.
The release also includes Azure SQL Health Monitor, a separate 63-report product designed specifically for Azure SQL Database. It analyzes Query Store, resource limits, throttling, plan regressions, memory grants, TempDB spills, read amplification, and cardinality-estimation accuracy without installing anything or creating Azure resources. One license covers both products, and existing Version 3 users can upgrade while retaining their registered servers, settings, and DBHealthHistory data.
See the Release Notes page for details on updates in older versions.