Compatibility Level Per Database: The Silent Plan Change
A database restored from an old server onto SQL Server 2022 runs fine, then a handful of queries start to crawl. Nobody changed any code. Nothing shows in the error log. Check the compatibility level per database and you will often find a 110 sitting on an instance that supports 160, quietly holding the legacy estimator in place.
How do I check the compatibility level per database in SQL Server? The compatibility level per database decides which cardinality estimator and which query processing features a database gets. A database left at an old level after a restore keeps the legacy estimator and misses newer optimizer behavior. Compare each database's level against the instance maximum, then check what its cached plans were actually compiled with.
Database Health Monitor has a report for exactly this, called Plan Settings by Database. It puts one row on screen per database and lines up every setting that can change which plan the optimizer picks.
Why one setting at a time misleads
Most people start with sys.configurations, or with the Configuration Values view of it, which is the right place for instance settings. If a value never took effect, Pending RECONFIGURE: Find Settings That Never Took Effect covers that trap.
But plan behavior is mostly decided below the instance. It lives in the database: the level, the scoped configurations, the statistics options, Query Store. Query one catalog view and you see one slice. You never see the level beside the estimator beside the hotfix flag.
And a setting being right on paper proves nothing. The only proof is what the cached plans were compiled with.
The compatibility level per database, and what sits beside it
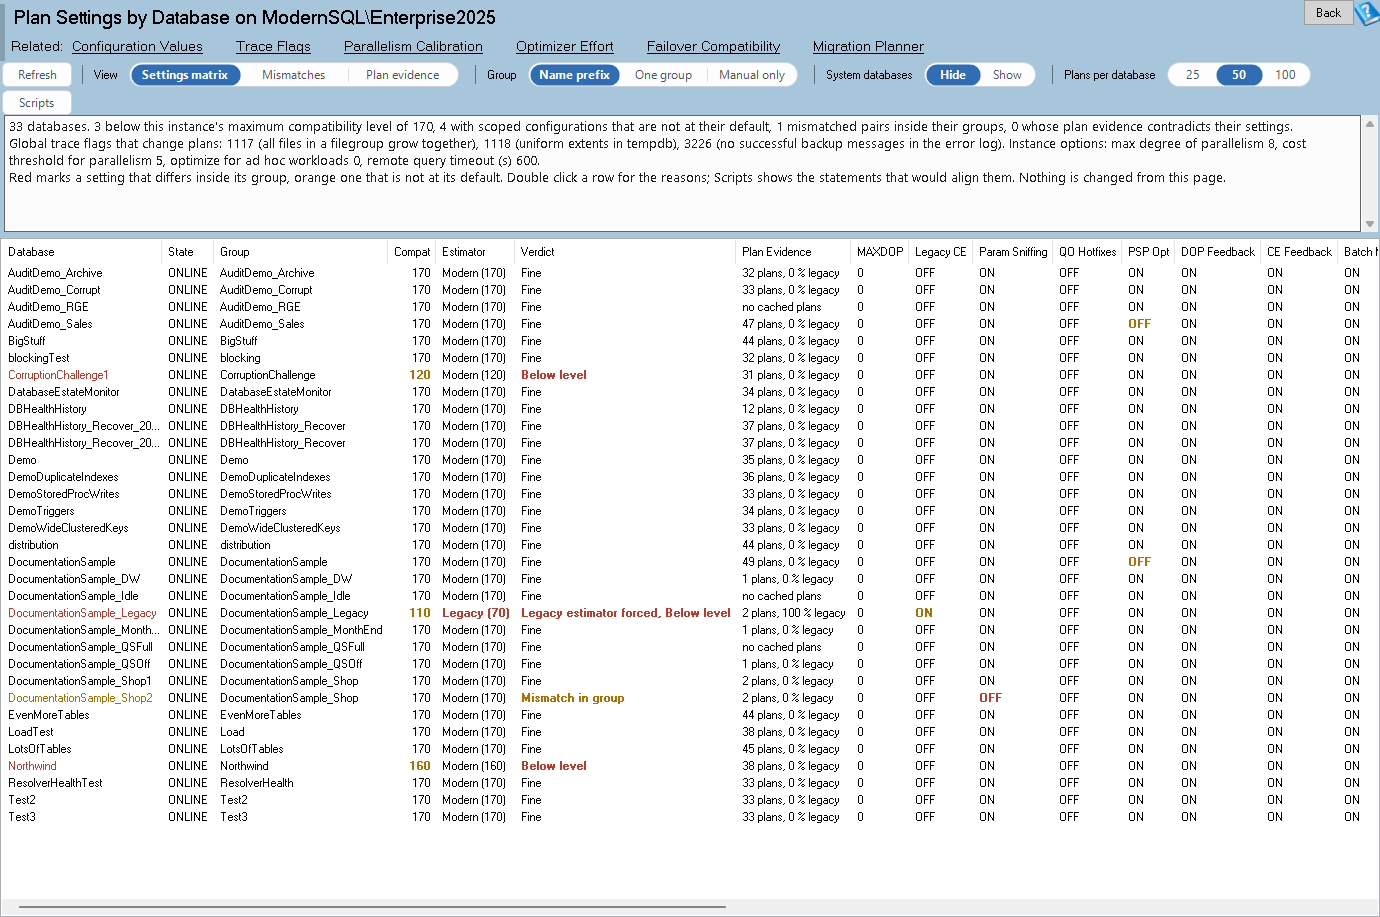
Plan Settings by Database is one of the reports in Database Health Monitor. It runs against your own servers, and it takes about a minute to have this same screen open on one of them.
These are the failures the page was built to catch. All of them are silent.
- A 2012 restore left at level 110 on a 2022 instance. It keeps the legacy estimator and misses batch mode on rowstore, adaptive joins and parameter sensitive plan optimization.
- Two databases that should match, but a migration script touched
LEGACY_CARDINALITY_ESTIMATIONon only one. - Development with
PARAMETER_SNIFFINGOFF and production without. The plans you tested are not the plans that ship. QUERY_OPTIMIZER_HOTFIXESoff everywhere and trace flag 4199 off. Years of optimizer fixes sit dormant.
The matrix view reads the level, the estimator really in force, ten of the scoped configurations that matter most (MAXDOP, optimizer hotfixes, DOP feedback, scalar UDF inlining and so on) and one column holding every other scoped configuration that is off its default. Beside those come the database options: automatic statistics, read committed snapshot, Query Store, auto close, auto shrink and more.
Orange means a value is off its default. Red means it differs from its peers. Hover a row and the reasons appear.

Verdicts, groups and the plan evidence
Each row ends in a verdict. Below level means the database sits under the instance maximum, and the reasons list what each step up would give it. Legacy estimator forced means the scoped option is ON or trace flag 9481 is global. A level under 120 implies the legacy model but is not called forced.
Mismatch in group is the useful one after a migration. Databases are compared with siblings that share a name prefix, such as Shop1 and Shop2 or a Dev and Prod pair. You can compare everything with everything, or group by hand and have the page remember it per instance. Each stray value comes with the ALTER DATABASE SCOPED CONFIGURATION or ALTER DATABASE SET text to align it.
Then there is Contradicted by plans. The settings say modern estimator, yet over half of at least five sampled plans carry model version 70. Something is forcing the old model: a hint, a plan guide, a forced plan. Only the plan evidence view can show you that. It samples the 25, 50 or 100 most expensive cached plans per database and reports the share using batch mode on rowstore, adaptive joins, interleaved execution and memory grant feedback.
The page changes nothing. Every statement is text to read and copy. Plan evidence needs VIEW SERVER STATE, and scoped configurations need SQL Server 2016 or later, though older instances still open the page. The full reference is on the Plan Settings by Database help page.
Before you raise any level, the Scripts button gives the advice the page itself recommends: turn Query Store on, let it run for a week, raise the level, then compare with Workload Change. A level change is a plan change. Measure it.
What to check on your own server
- Compare each database's compatibility level with the highest level your instance supports
- Check whether LEGACY_CARDINALITY_ESTIMATION is ON for any database, and whether trace flag 9481 is global
- Compare PARAMETER_SNIFFING and the other scoped configurations between development and production copies of the same database
- Look at QUERY_OPTIMIZER_HOTFIXES and trace flag 4199 on databases already at the maximum level
- Sample the most expensive cached plans and read CardinalityEstimationModelVersion to see which estimator they used
Try Database Health Monitor Today
Plan Settings by Database shows every plan-affecting setting for every database on one screen, so a silent legacy estimator or a drifted scoped configuration cannot hide. Database Health Monitor shows it on every instance you connect, in the time it takes to open the report.
Download Database Health Monitor and run the Plan Settings by Database report against your own server. There is nothing to configure first, and you will know inside a few minutes whether it tells you something you did not already know.