Memory Grant Waits: Find the Queries That Queued
A report runs in two seconds all week, then crawls at 9:15 on Tuesday morning. By the time you connect, it is fast again, CPU looks bored, and nothing is blocked. That pattern is usually memory grant waits: queries that were ready to run but stood in line for workspace memory.
How do I find memory grant waits that happened when I was not watching SQL Server? Memory grant waits happen when queries queue on RESOURCE_SEMAPHORE because the server has no workspace memory to hand out. Because the queuing is brief and intermittent, you catch it by reading history. Group the sampled waits into episodes, then rank statements by total wait to see which few queries cause most of it.
That is why the usual checks come up empty. Database Health Monitor keeps the evidence after the moment has passed, and the first thing to learn is why the live view cannot.
The live view is always too late
The obvious move is to open a page of current memory grants and look for sessions that have not been granted yet. It is the right tool for a queue that is happening this minute. The trouble is that grant queuing is intermittent. A burst of large sorts and hashes can pile up for a few minutes, drain, and leave nothing behind.
So you look at a clean screen, conclude the problem is gone, and wait for the next complaint. Each round teaches you nothing about which statements were in the queue or when it started.
A second shortcut is to watch the Memory Grants Pending counter. That helps, but a counter tells you that something waited. It does not tell you who.
Measure the wait per statement, then group it
The honest number is time spent waiting on RESOURCE_SEMAPHORE, attributed to the statement that waited. Sampled over days, it can be turned into something you can act on.
Here is how the report does that. Each sample of a session waiting is placed in its minute. Minutes less than 5 minutes apart are treated as one episode. Each episode shows when it started, how long it lasted, the most sessions waiting in a single minute, the summed wait, how many statements waited, and the worst one.
Compile memory is handled separately. RESOURCE_SEMAPHORE_QUERY_COMPILE is the memory a compile waits for, and it is not counted inside an episode. It appears in the headline and as an amber layer in the daily chart, so compile pressure never gets mistaken for grant pressure.
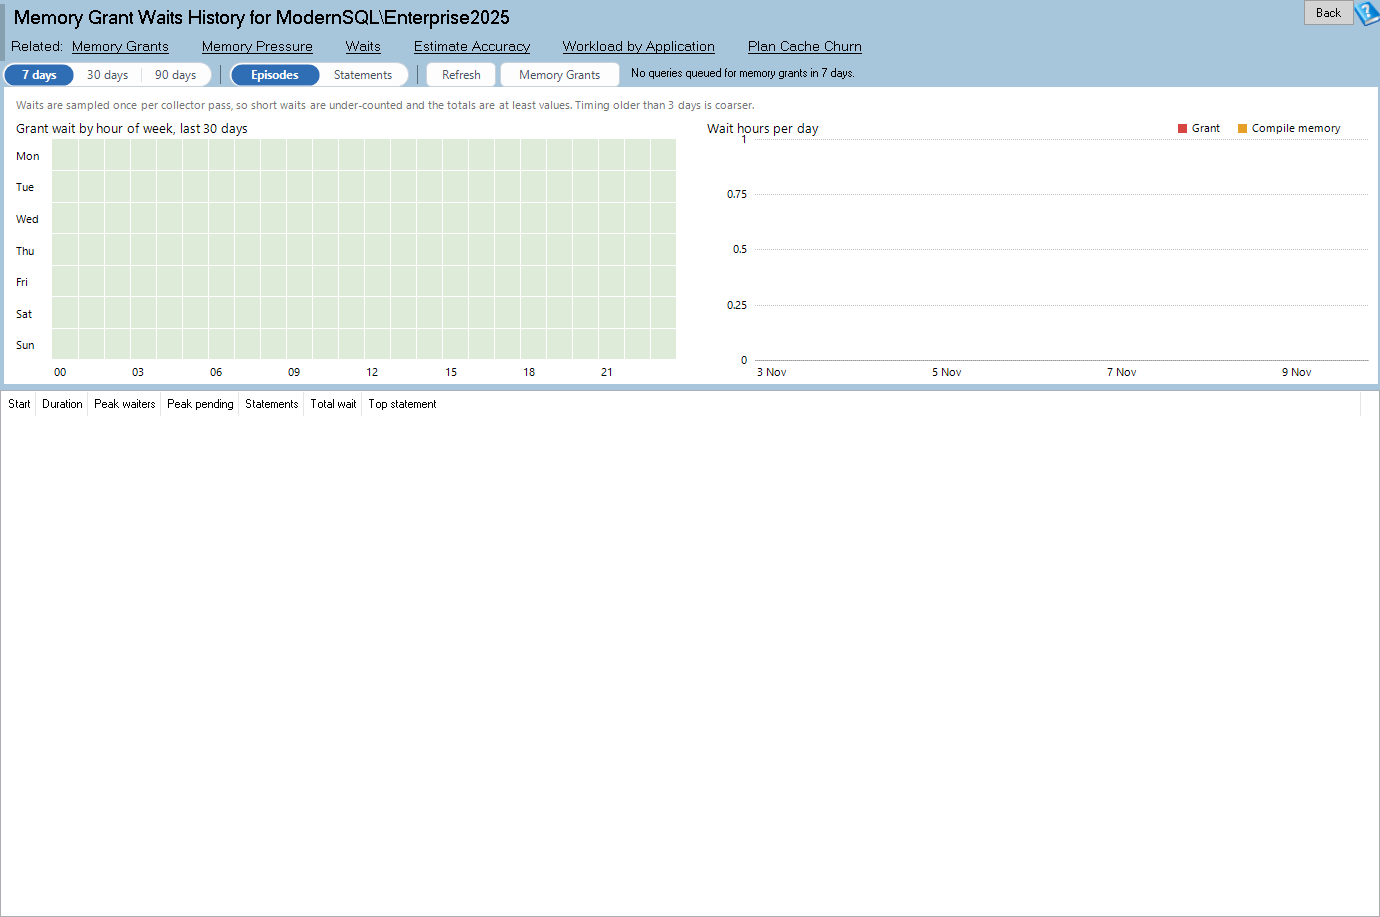
Memory Grant Waits History is one of the reports in Database Health Monitor. It runs against your own servers, and it takes about a minute to have this same screen open on one of them.
What the page puts on screen
The headline is a verdict in one line. A typical one reads: queries waited at least 4.1 hours in 30 days across 23 episodes, most often Tuesday 09:00 to 10:00, with 70 percent of the wait in two statements. That is a sentence you can paste into a ticket.
Under it are two charts. The left one is a heat map of grant wait by hour of week for the last 30 days, Monday first. The right one shows wait hours per day, red for grants and amber for compile memory. Then the grid, with two buttons:
- Episodes lists each episode, newest first, with start, duration, peak sessions waiting and the top statement.
- Statements ranks statements by wait across all episodes, with their share of the total plus the database, program and login of their longest wait. The top 200 by wait are read.
Switching between them does not re-read the history. On the instance hosting the history database, each episode also shows a peak pending value from the Memory Grants Pending counter. That counter has no instance column, so other monitored instances leave it blank.
It reads only the DBHealthHistory database, which means it still opens when the monitored instance is down. Historic Monitoring must be set up first, otherwise the page says Historic monitoring is not set up for this instance. If you want the full reference, see Memory Grant Waits History.
What to do with the answer
The advice line under the headline depends on the pattern it finds, and each pattern points somewhere different.
| Pattern | Where to look |
|---|---|
| One or two statements hold half the wait or more | Bad row estimates, sorts and hashes on wide rows, or max server memory set too low |
| Many sessions waiting, no dominant statement | A concurrency peak, so check Workload by Application |
| Compile memory waits | Compile storms, so check Plan Cache Churn |
The first row is the common win. If two statements own most of the wait, fixing their estimates beats buying memory. The second says the workload itself stacks up at one hour, and the heat map tells you which hour.
Be honest about the limits. Waits are sampled once per collector pass, so anything shorter than a pass is under-counted. Treat every total as at least that much, and use the summed wait to rank statements, not as a stopwatch. Past 3 days the history rollup thins timestamps, so old episodes can merge or split differently than recent ones, although daily totals are unaffected. The heat map reads 30 days only.
The page also does not show desired and granted memory for a statement. That needs a captured plan. If you have chased a similar slow-burn problem before, the approach will feel familiar from Find the Head Blocker Behind a Month of Blocking, which uses the same history database to answer a question the live view cannot.
What to check on your own server
- Open the history for the last 30 days and read the headline for total wait and episode count
- Switch to Statements and note whether one or two statements hold half the wait or more
- Check the hour of week heat map for a repeating slot such as Tuesday morning
- Compare the dominant statement's row estimates against reality before touching max server memory
- Read every total as a minimum, because short waits between collector passes go unseen
Try Database Health Monitor Today
Memory Grant Waits History turns brief RESOURCE_SEMAPHORE queuing into dated episodes and a ranked list of the statements that caused them. Database Health Monitor shows it on every instance you connect, in the time it takes to open the report.
Download Database Health Monitor and run the Memory Grant Waits History report against your own server. There is nothing to configure first, and you will know inside a few minutes whether it tells you something you did not already know.