Find the Head Blocker Behind a Month of Blocking
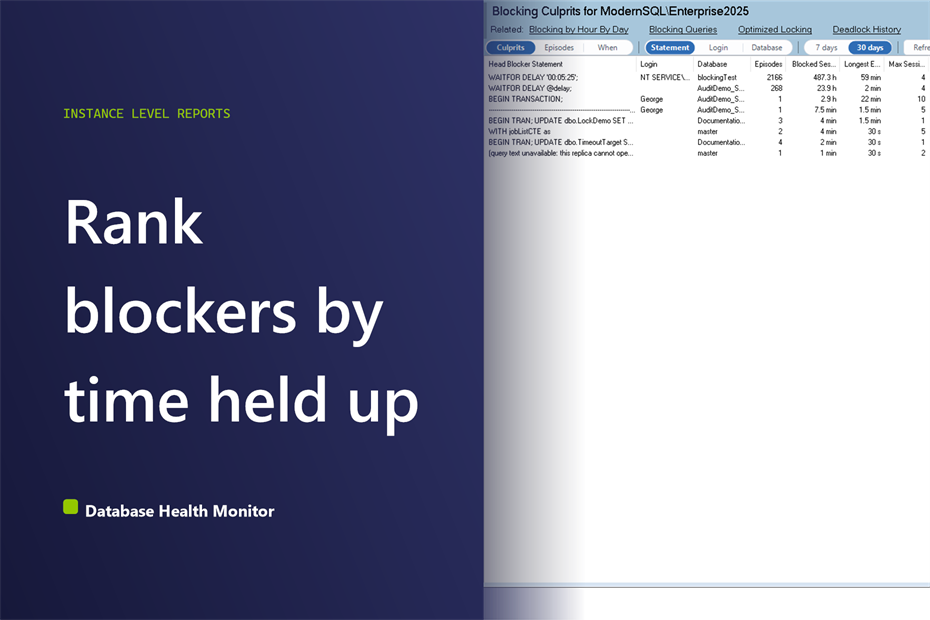
Someone asks in the post mortem who was responsible for the month of blocking, and all you have is one bad afternoon you caught live. You remember a head blocker from Tuesday. You do not know whether it was the worst one, or just the one you happened to be watching.
How do I find the head blocker behind weeks of blocking in SQL Server? Rank every head blocker by the session time it held up, not by how often it appeared. Over a week or a month of blocking history, a handful of statements usually account for most of the blocked time, and the worst are often an application leaving a transaction open.
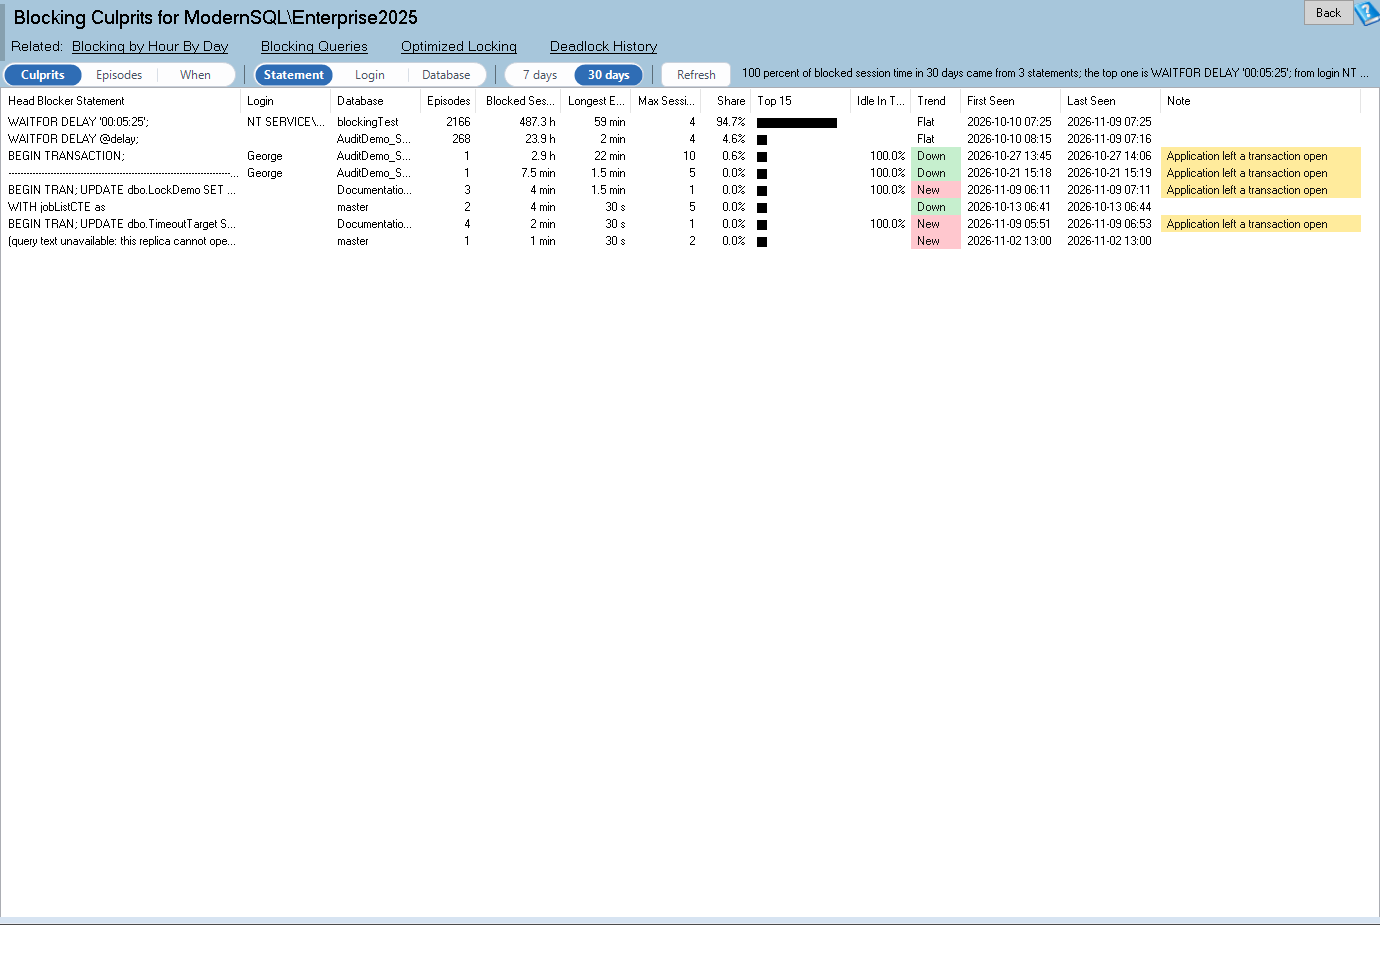
Database Health Monitor answers that with the Blocking Culprits report. It does not look at one moment. It looks at everything the collector saw, and puts a name at the top.
Blocking Culprits is one of the reports in Database Health Monitor. It runs against your own servers, and it takes about a minute to have this same screen open on one of them.
Why the obvious counts mislead
The first instinct is to count. Which statement shows up most often in the blocking list? Which one did you see last?
Both are weak. A statement that blocks one session for four seconds, three hundred times, looks busy. A statement that sat idle inside an open transaction for forty minutes and stalled twelve sessions shows up a handful of times. The second one hurt far more people.
Frequency also hides who was waiting. Two sessions blocked for two minutes are four minutes of lost work, and that is the unit worth ranking by.
Rank each head blocker by time held up
The blocking collector samples roughly every 30 seconds while any blocking exists, and records the session at the front of each chain. The report strings the samples of one statement into episodes. Samples belong together until there is a gap of more than 45 seconds, and then a new episode starts.
Blocked session time is the number of sessions blocked in each sample, multiplied by that 30 second cadence, summed over the episode. It is an approximation. It is also a consistent one, which is what a ranking needs.
Statements are folded before they are grouped. Literals are normalized, so the same UPDATE run for order 1001 and order 1002 is a single culprit, not two hundred.
Because the report reads only the DBHealthHistory database, it opens even when the monitored instance is down. That matters at the exact moment you are asked for the numbers.

What the grid tells you to do
One row per culprit, heaviest first. Read these columns before anything else:
- Blocked session time and share, which say how much of the total the row owns.
- Longest episode and the most sessions blocked at once, which separate a steady grind from a single pile-up.
- Trend, which compares the last 7 days with the days before: Up, Down, Flat, or New.
- The idle share, which is the portion of blocked time the blocker spent sitting in an open transaction.
When a culprit was idle in a transaction for at least half of its blocked time, the report tags it Application left a transaction open. That is not a tuning problem. Nothing in the query is slow, because the query finished. The application did not commit.
The fix lives in the code. Commit sooner, keep transactions short, turn on SET XACT_ABORT ON so an error rolls back, and check that connection pool resets are not leaving work uncommitted. To see what such a session looks like live, read Who Is Connected to SQL Server, and What They're Doing.
Switch the grouping between Statement, Login and Database without a new query. If one login owns half the blocked time, that is a conversation with one team. Double click a row for its episodes, or right click for the statement and the plan of its worst episode when one was saved.
The When view lays episodes out by day and hour. It tells you whether you are looking at the nightly batch or the Monday morning rush, which decides who gets the call.
Know the limits before you quote a number. Blocking is recorded only for the server hosting DBHealthHistory, history is kept for the collector's purge days (30 by default), and the chain records the login but not the host or program. The full reference is in the Blocking Culprits documentation.
What to check on your own server
- Open the 30 day window and read the headline sentence for the share of blocked time owned by the top statements
- Sort the culprits by blocked session time and ignore episode count until you have read the top five rows
- Look for rows tagged Application left a transaction open and send them to the owning developers
- Switch the grouping to Login, then Database, and note whether one account or one database owns the blocking
- Open the When view and check whether episodes cluster in the nightly batch or the Monday morning rush
Try Database Health Monitor Today
Blocking Culprits ranks the head blockers behind a week or a month of blocking by the session time they held up, so the post mortem has a name in it. Database Health Monitor shows it on every instance you connect, in the time it takes to open the report.
Download Database Health Monitor and run the Blocking Culprits report against your own server. There is nothing to configure first, and you will know inside a few minutes whether it tells you something you did not already know.